#=============================================================================#
#Library Load-in---------------------------------------------------------------
#=============================================================================#
library(dplyr) #data wrangling
library(purrr) #iteration assist
library(ggplot2) #plotting
library(sp) #polygon manipulation
#=============================================================================#
#Data Set-up-------------------------------------------------------------------
#=============================================================================#
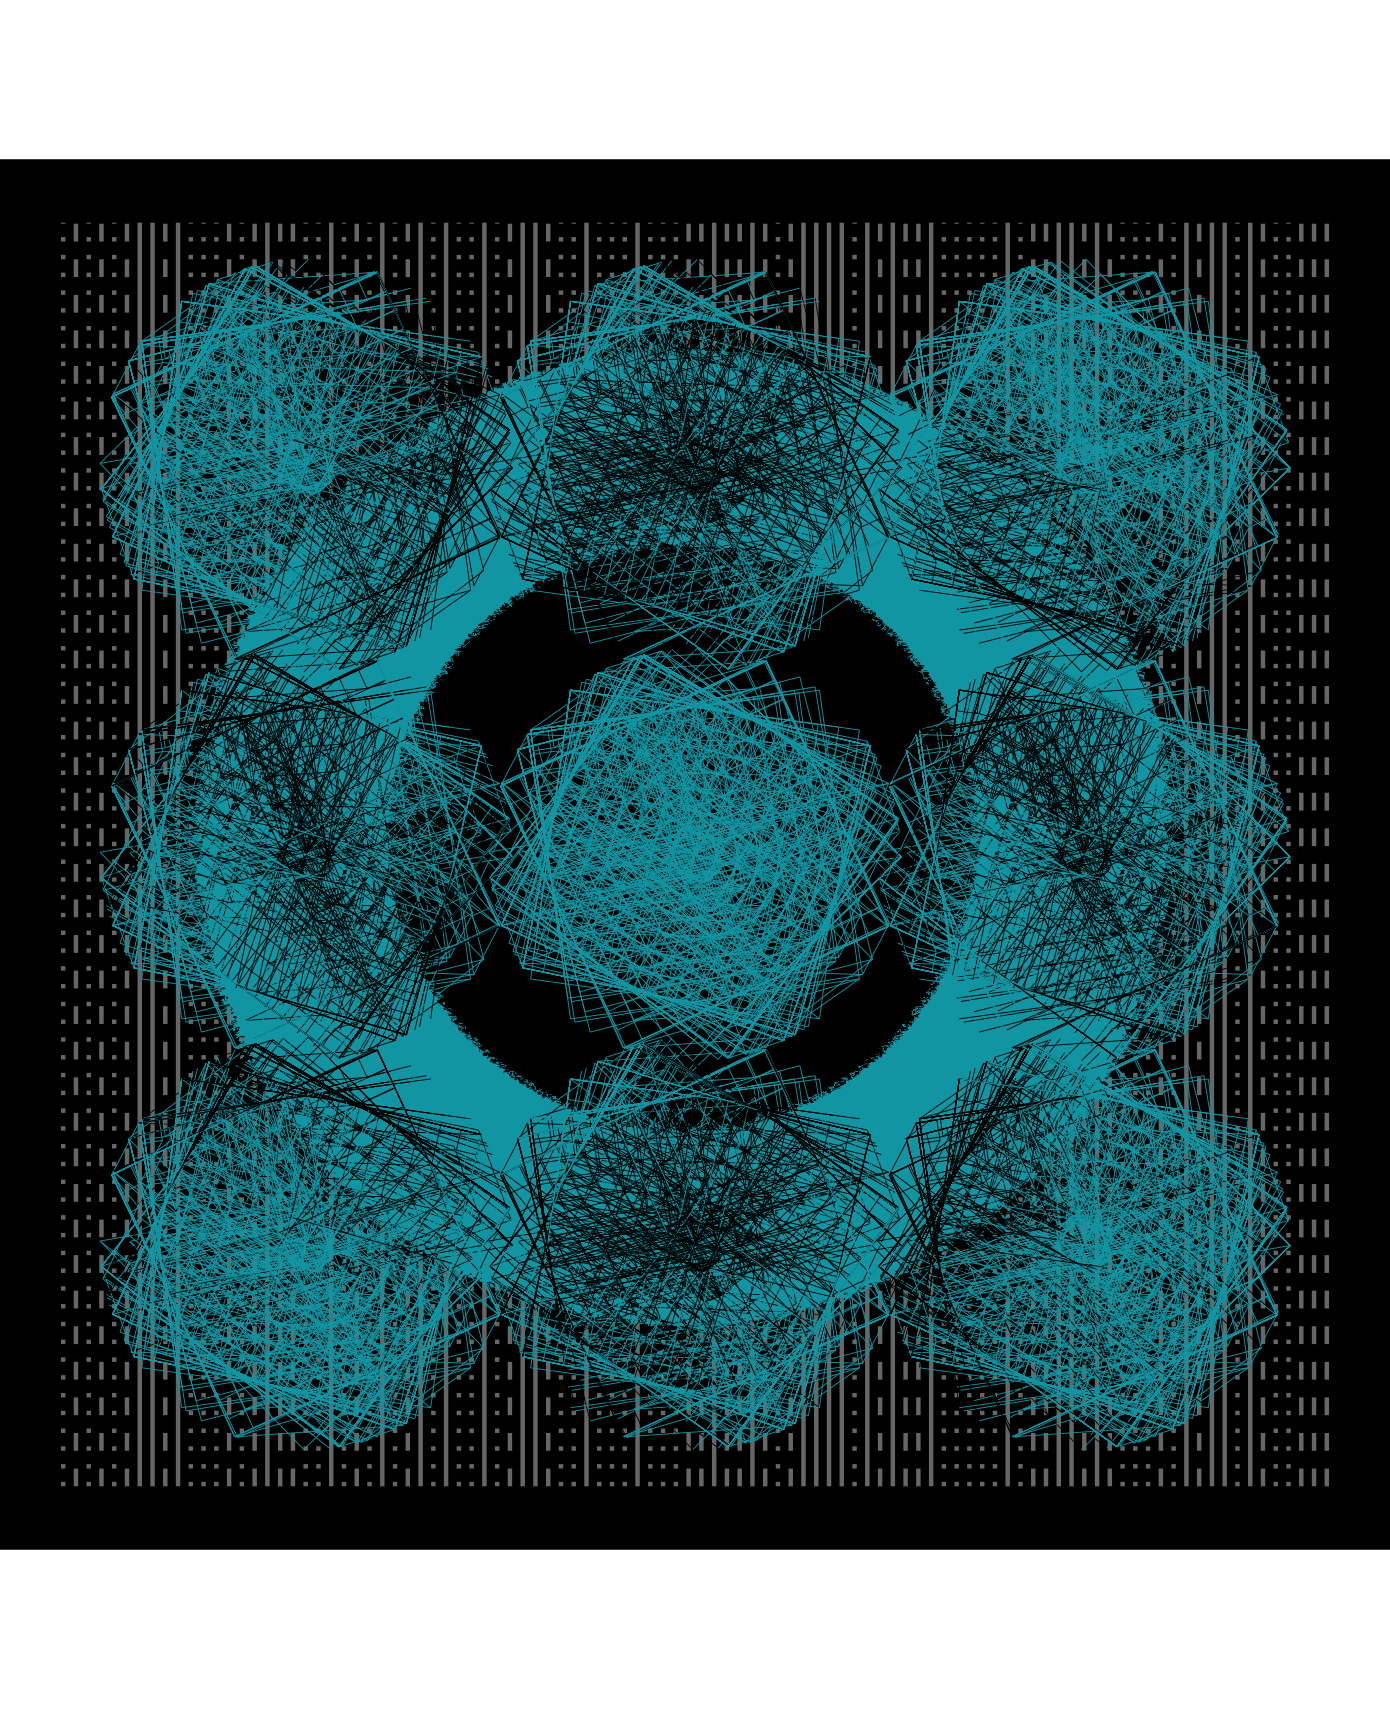
#Base square data#
square <- tibble(x = c(0,1,1,0,0),
y = c(0,0,1,1,0))
#Number of iterations#
n <- 15
#scale transfromations#
scaler <- seq(0,3, length = n)
positioner <- rev(scaler)
#Iteration options#
square_opts <- list(scaler, positioner, 1:n)
#Square data (One of them)
square_df <- pmap_df(square_opts, ~square |>
mutate(x = (x * ..1) + ..2,
y = (y * ..1) + ..2,
group = paste0("group",..3)))
#Rotation fx#
shape_rotator <- function(df, angle = 5){
mp = list("x" = (min(df$x)+max(df$x))/2,
"y" = (min(df$y)+max(df$y))/2)
rotated_shape <- df %>%
mutate(x2 = (x - mp$x)*cos(angle) - (y - mp$y)*sin(angle) + mp$x,
y2 = (x - mp$x)*sin(angle) + (y - mp$y)*cos(angle) + mp$y,
x = x2,
y = y2) %>%
select(-c(x2,y2))
rotated_shape
}
#Number of angles to sample#
anglesn <- 20
#sampled angles#
angles <- sample(1:360, anglesn, replace = TRUE)
#scale transfomer#
trans <- seq(0,10, by = 4)
#iteration helper#
nlength <- 1:length(trans)
#Final square data compilation#
square_df2 <- map2_df(trans, nlength, ~map2_df(trans, nlength, ~map2_df(anglesn, angles, ~shape_rotator(square_df, angle = .y) |>
mutate(group = paste0(group,.x))) |>
mutate(group = paste0(group,"-row",.y),
x = x + .x)) |>
mutate(group = paste0(group,"-col",.y),
y = y + .x))
#Donut data compilation#
center <- tibble(x = (cos(seq(0,2*pi, length = 10000)) * 5) + mean(square_df2$x),
y = (sin(seq(0,2*pi, length = 10000)) * 5) + mean(square_df2$y),
group = "circle")
mini_center <- tibble(x = (cos(seq(0,2*pi, length = 10000)) * 3) + mean(square_df2$x),
y = (sin(seq(0,2*pi, length = 10000)) * 3) + mean(square_df2$y),
group = "mini circle")
#Final datafram to account for the donut#
final_df <- square_df2 |>
mutate(logic = point.in.polygon(x,y,center$x, center$y),
color = if_else(logic == 1, "#000000", "#1295a3"),
logic = point.in.polygon(x,y,mini_center$x, mini_center$y),
color = if_else(logic == 1, "#1295a3", color))
#Background data for patterns#
background <- tibble(x = seq(round(min(final_df$x)), round(max(final_df$x)), length.out = 100),
xend = x,
y = round(min(final_df$y)),
yend = round(max(final_df$y)))
#=============================================================================#
#Final Piece-------------------------------------------------------------------
#=============================================================================#
final_df |>
ggplot(aes(x,y, group = group))+
theme_void()+
theme(plot.background = element_rect(fill = "#000000"))+
geom_segment(data = background, aes(x,y,xend = xend, yend = yend),
inherit.aes = FALSE,
linetype = (sample(1:3, nrow(background), replace = TRUE)),
color = "#ffffff",
alpha = .4)+
geom_polygon(data = center,
fill = "#1295a3",
position = position_jitter(width = .05, height = .03))+
geom_polygon(data = mini_center,
fill = "#000000",
position = position_jitter(width = .05, height = .03))+
geom_path(linewidth = .1,
color = final_df$color)+
coord_equal()