#=============================================================================#
#Library Load-in---------------------------------------------------------------
#=============================================================================#
library(dplyr)
library(purrr)
library(ggplot2)
#=============================================================================#
#Data Set-up-------------------------------------------------------------------
#=============================================================================#
#Number of zig zags#
n = 200
#Page Limits#
xmin = 0
xmax = 100
ymin = 0
ymax = 100
#Zig Zag data#
zig_zag <- tibble(x = c(0,1,1.5,2,2.5,3,3.5),
y = c(0,.5,0,.5,0,.5,0),
group = "zigzag")
#Zig Zag rotatations
rotates <- sample(0:360, n, replace = TRUE)
#Scale transformations
xtrans <- sample(xmin:xmax, n, replace = TRUE)
ytrans <- sample(ymin:ymax, n, replace = TRUE)
#Shape rotating fx#
shape_rotator <- function(df, angle = 5){
mp = list("x" = (min(df$x)+max(df$x))/2,
"y" = (min(df$y)+max(df$y))/2)
rotated_shape <- df %>%
mutate(x2 = (x - mp$x)*cos(angle) - (y - mp$y)*sin(angle) + mp$x,
y2 = (x - mp$x)*sin(angle) + (y - mp$y)*cos(angle) + mp$y,
x = x2,
y = y2) %>%
select(-c(x2,y2))
rotated_shape
}
#Zig zag color choices#
zig_colors <- colorRampPalette(c("#FD77AD", "#791E9A", "#00E700",
"#03B5C4", "#ffffff", "#D45A49"))(n)
#Zig zag options#
zig_opts <- list(xtrans,
ytrans,
rotates,
1:n,
zig_colors)
#Zig zag data compilation#
zigs <- pmap_df(zig_opts, ~shape_rotator(zig_zag |>
mutate(x = x + ..1,
y = y + ..2,
group = paste0(group,..4),
color = ..5),..3)
)
#Background color data#
back <- tibble(x = seq(xmin,xmax, length = 100),
xend = x,
y = ymin,
yend = ymax,
color = colorRampPalette(c("#FED22B","#4652C9"))(100))
#Number of random shapes#
shapen <- 50
#Shape data#
square <- tibble(x = c(0,1,1,0,0),
y = c(0,0,1,1,0),
group = "square")
triangle <- tibble(x = c(0,1,.5,0),
y = c(0,0,1,0),
group = "triangle")
circle <- tibble(x = cos(seq(0,2*pi, length = 100)),
y = sin(seq(0,2*pi, length = 100)),
group = "circle")
#randomly sampled angles for shape rotation#
rotates <- sample(0:360, shapen, replace = TRUE)
#scale transformations#
xtrans <- sample(xmin:xmax, shapen, replace = TRUE)
ytrans <- sample(ymin:ymax, shapen, replace = TRUE)
scales <- sample(1:10, shapen, replace = TRUE)
#shape colors#
shape_colors <- colorRampPalette(c("#FD77AD", "#791E9A", "#00E700", "#03B5C4",
"#ffffff", "#D45A49", "#FFE553"))(shapen)
#Randomly picked shapes#
shapes <- sample(list(square,triangle,circle), shapen, replace = TRUE)
#shape options for iterations#
shape_opts <- list(xtrans,
ytrans,
rotates,
1:shapen,
shape_colors,
shapes,
scales,
sample(c("#000000", "#ffffff"), shapen, replace = TRUE))
#Shapes data compilation#
shapes_df <- pmap_df(shape_opts, ~shape_rotator(..6|>
mutate(x = x * ..7,
y = y * ..7,
x = x + ..1,
y = y + ..2,
group = paste0(group,..4),
color = ..5,
linecolor = ..8),..3)
)
#overall texture data#
texture <- tibble(expand.grid(x = seq(xmin, xmax, length = 50),
y = seq(ymin, ymax, length = 50)))
#=============================================================================#
#Final Piece-------------------------------------------------------------------
#=============================================================================#
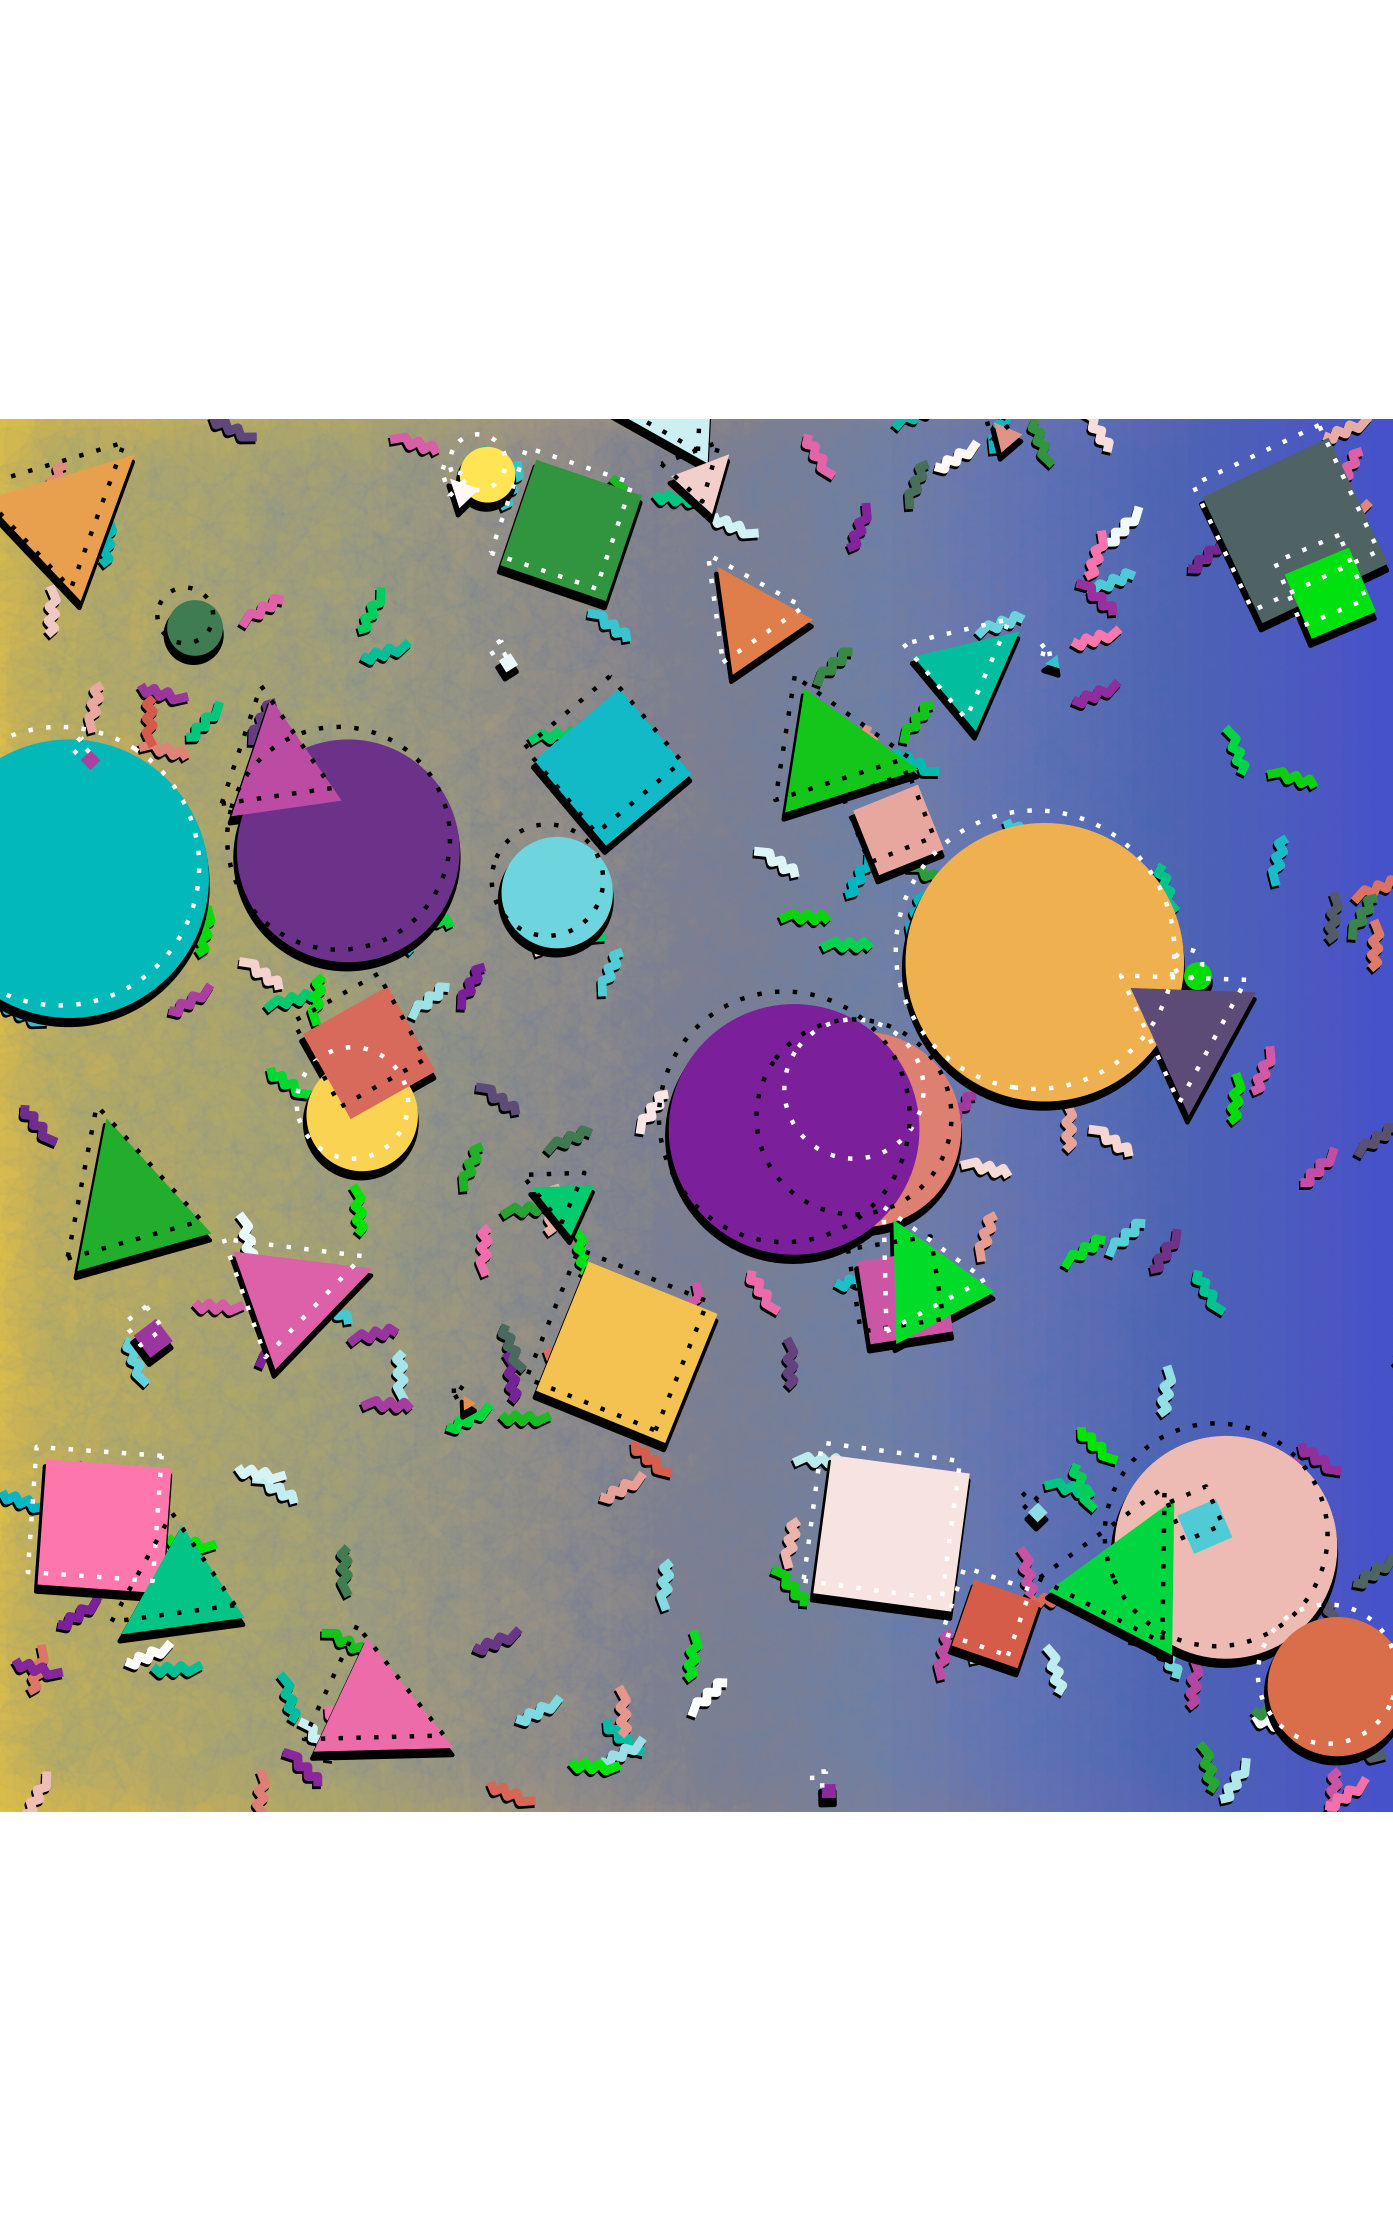
zigs |>
ggplot(aes(x,y, group = group)) +
theme_void()+
theme(plot.background = element_rect(fill = "#FED22B"))+
geom_segment(data = back, aes(x,y, xend = xend, yend = yend),
inherit.aes = FALSE,
color = back$color,
linewidth = 5)+
geom_point(data = texture, aes(group = 1),
size = sample(seq(12,18, length = 50), nrow(texture), replace = TRUE),
alpha = .02,
color = "#4652C9",
position = position_jitter(width = .3, height = .2))+
geom_path(aes(x = x - .1, y = y - .2),
color = "#000000",
linewidth = 1)+
geom_path(color = zigs$color,
linewidth = 1)+
geom_polygon(data = shapes_df, aes(x = x -.1, y = y -.5),
fill = "#000000",
color = "#000000")+
geom_polygon(data = shapes_df,
fill = shapes_df$color)+
geom_path(data = shapes_df, aes(x = x - .7, y = y + .9),
color = shapes_df$linecolor,
linetype = 3)+
coord_equal(expand = FALSE,
ylim = c(ymin, ymax),
xlim = c(xmin,xmax))
#To save the output:
# ggsave("images/22.png",
# dpi = 300,
# device = "png",
# bg = "transparent")