#=============================================================================#
#Library Load-In---------------------------------------------------------------
#=============================================================================#
library(dplyr) #For data wrangling
library(ggplot2) #For plotting
library(sp) #For polygon filtering
#=============================================================================#
#Data Set-up-------------------------------------------------------------------
#=============================================================================#
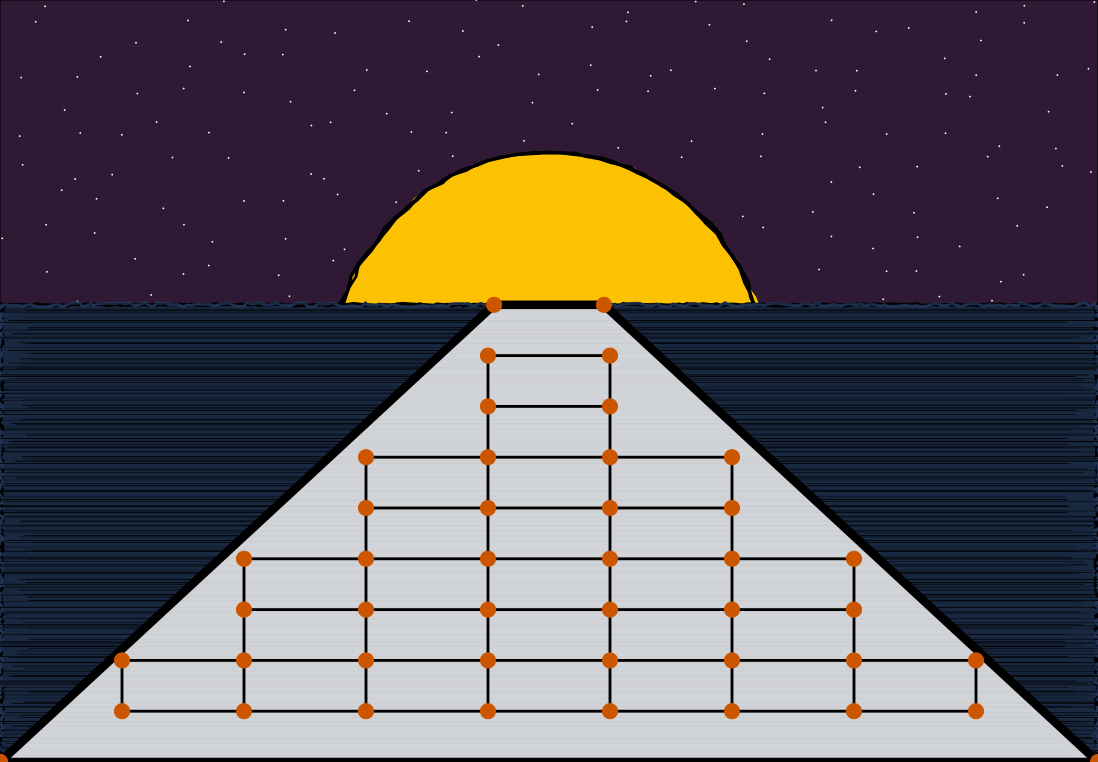
# Manual data for the road#
road <- tibble(x = c(0,100,55,45,0),
y = c(0,0,60,60,0))
# Data for the grass/ground area#
grass <- tibble(x = c(seq(0,100, length = 200),
rep(100,200),
seq(100,0, length = 200),
rep(0,200)),
y = c(rep(0,200),
seq(0,60, length = 200),
rep(60,200),
seq(60,0, length = 200)))
# Data for the stars#
stars <- tibble(expand.grid(x = seq(0,100, length = 20),
y = seq(60,100, length = 10)))
# Theta/Angle to create the moon#
theta_moon <- seq(0,2*pi, length = 100)
# Data for the moon#
moon <- tibble(x = 20*cos(theta_moon)+50,
y = 30*sin(theta_moon)+50)
# Data to add texture to the road#
road_texture <- tibble(expand.grid(x = seq(0,100, length = 10),
y = seq(0,60, length = 10)))
# Filtering out the data to only lay in our pre-made "road" shape#
road_texture <- road_texture %>%
mutate(logic = point.in.polygon(x,y,road$x,road$y))%>%
filter(logic == 1)
# Data for the "texture" of our ground/grass
grass_texture <- tibble(x = rep(0,200),
xend = rep(100,200),
y = seq(0,60, length = 200),
yend = y)
#=============================================================================#
#Final Piece-------------------------------------------------------------------
#=============================================================================#
stars %>%
ggplot(aes(x,y))+
theme_void()+
theme(plot.background = element_rect(fill = "#301934"))+
geom_point(position = "jitter", size = .01, color = "white")+
geom_polygon(data = moon,
position = position_jitter(width = .3, height = .1),
fill = "#FCC201", linewidth = 1)+
geom_polygon(data = moon,
position = position_jitter(width = .3, height = .1),
fill = NA,
color = "black",
linewidth = 1)+
geom_polygon(data = moon,
position = position_jitter(width = .3, height = .1),
fill = NA,
color = "black",
linewidth = 1)+
geom_polygon(data = moon,
position = position_jitter(width = .3, height = .1),
fill = NA,
color = "black",
linewidth = 1)+
geom_polygon(data = grass,
position = position_jitter(width = .3, height = .1),
fill = "#192841",
color = "black",
linewidth = 1)+
geom_polygon(data = grass,
position = position_jitter(width = .3, height = .2),
fill = NA,
color = "black",
linewidth = 1)+
geom_polygon(data = grass,
position = position_jitter(width = .3, height = .3),
fill = NA,
color = "#203354",
linewidth = 1)+
geom_segment(data = grass_texture, aes(x=x,y=y,xend=xend,yend=yend),
position = position_jitter(width = 3, height = .3),
color = "black",
linewidth = .3,
inherit.aes = FALSE,
alpha = sample(seq(.4,1, length = 10), nrow(grass_texture), replace = TRUE))+
geom_polygon(data = road,
fill = "white",
alpha = .8)+
geom_path(data = road,
color = "black",
linewidth= 3)+
geom_line(data = road_texture, aes(group = x),
linewidth = 1,
color = "#000000")+
geom_line(data = road_texture, aes(group = y),
linewidth = 1,
color = "#000000")+
geom_line(data = road, aes(group = y),
linewidth = 1,
color = "#000000")+
geom_point(data = road,
size = 5,
color = "#cc5500")+
geom_point(data = road_texture,
size = 5,
color = "#cc5500")+
coord_cartesian(xlim = c(0,100),
ylim = c(0,100),
expand = FALSE)
#To save the output:
# ggsave("images/05.png",
# dpi = 300,
# device = "png")