#=============================================================================#
#Library Load-in---------------------------------------------------------------
#=============================================================================#
library(dplyr)
library(ggplot2)
#=============================================================================#
#Data Creation-----------------------------------------------------------------
#=============================================================================#
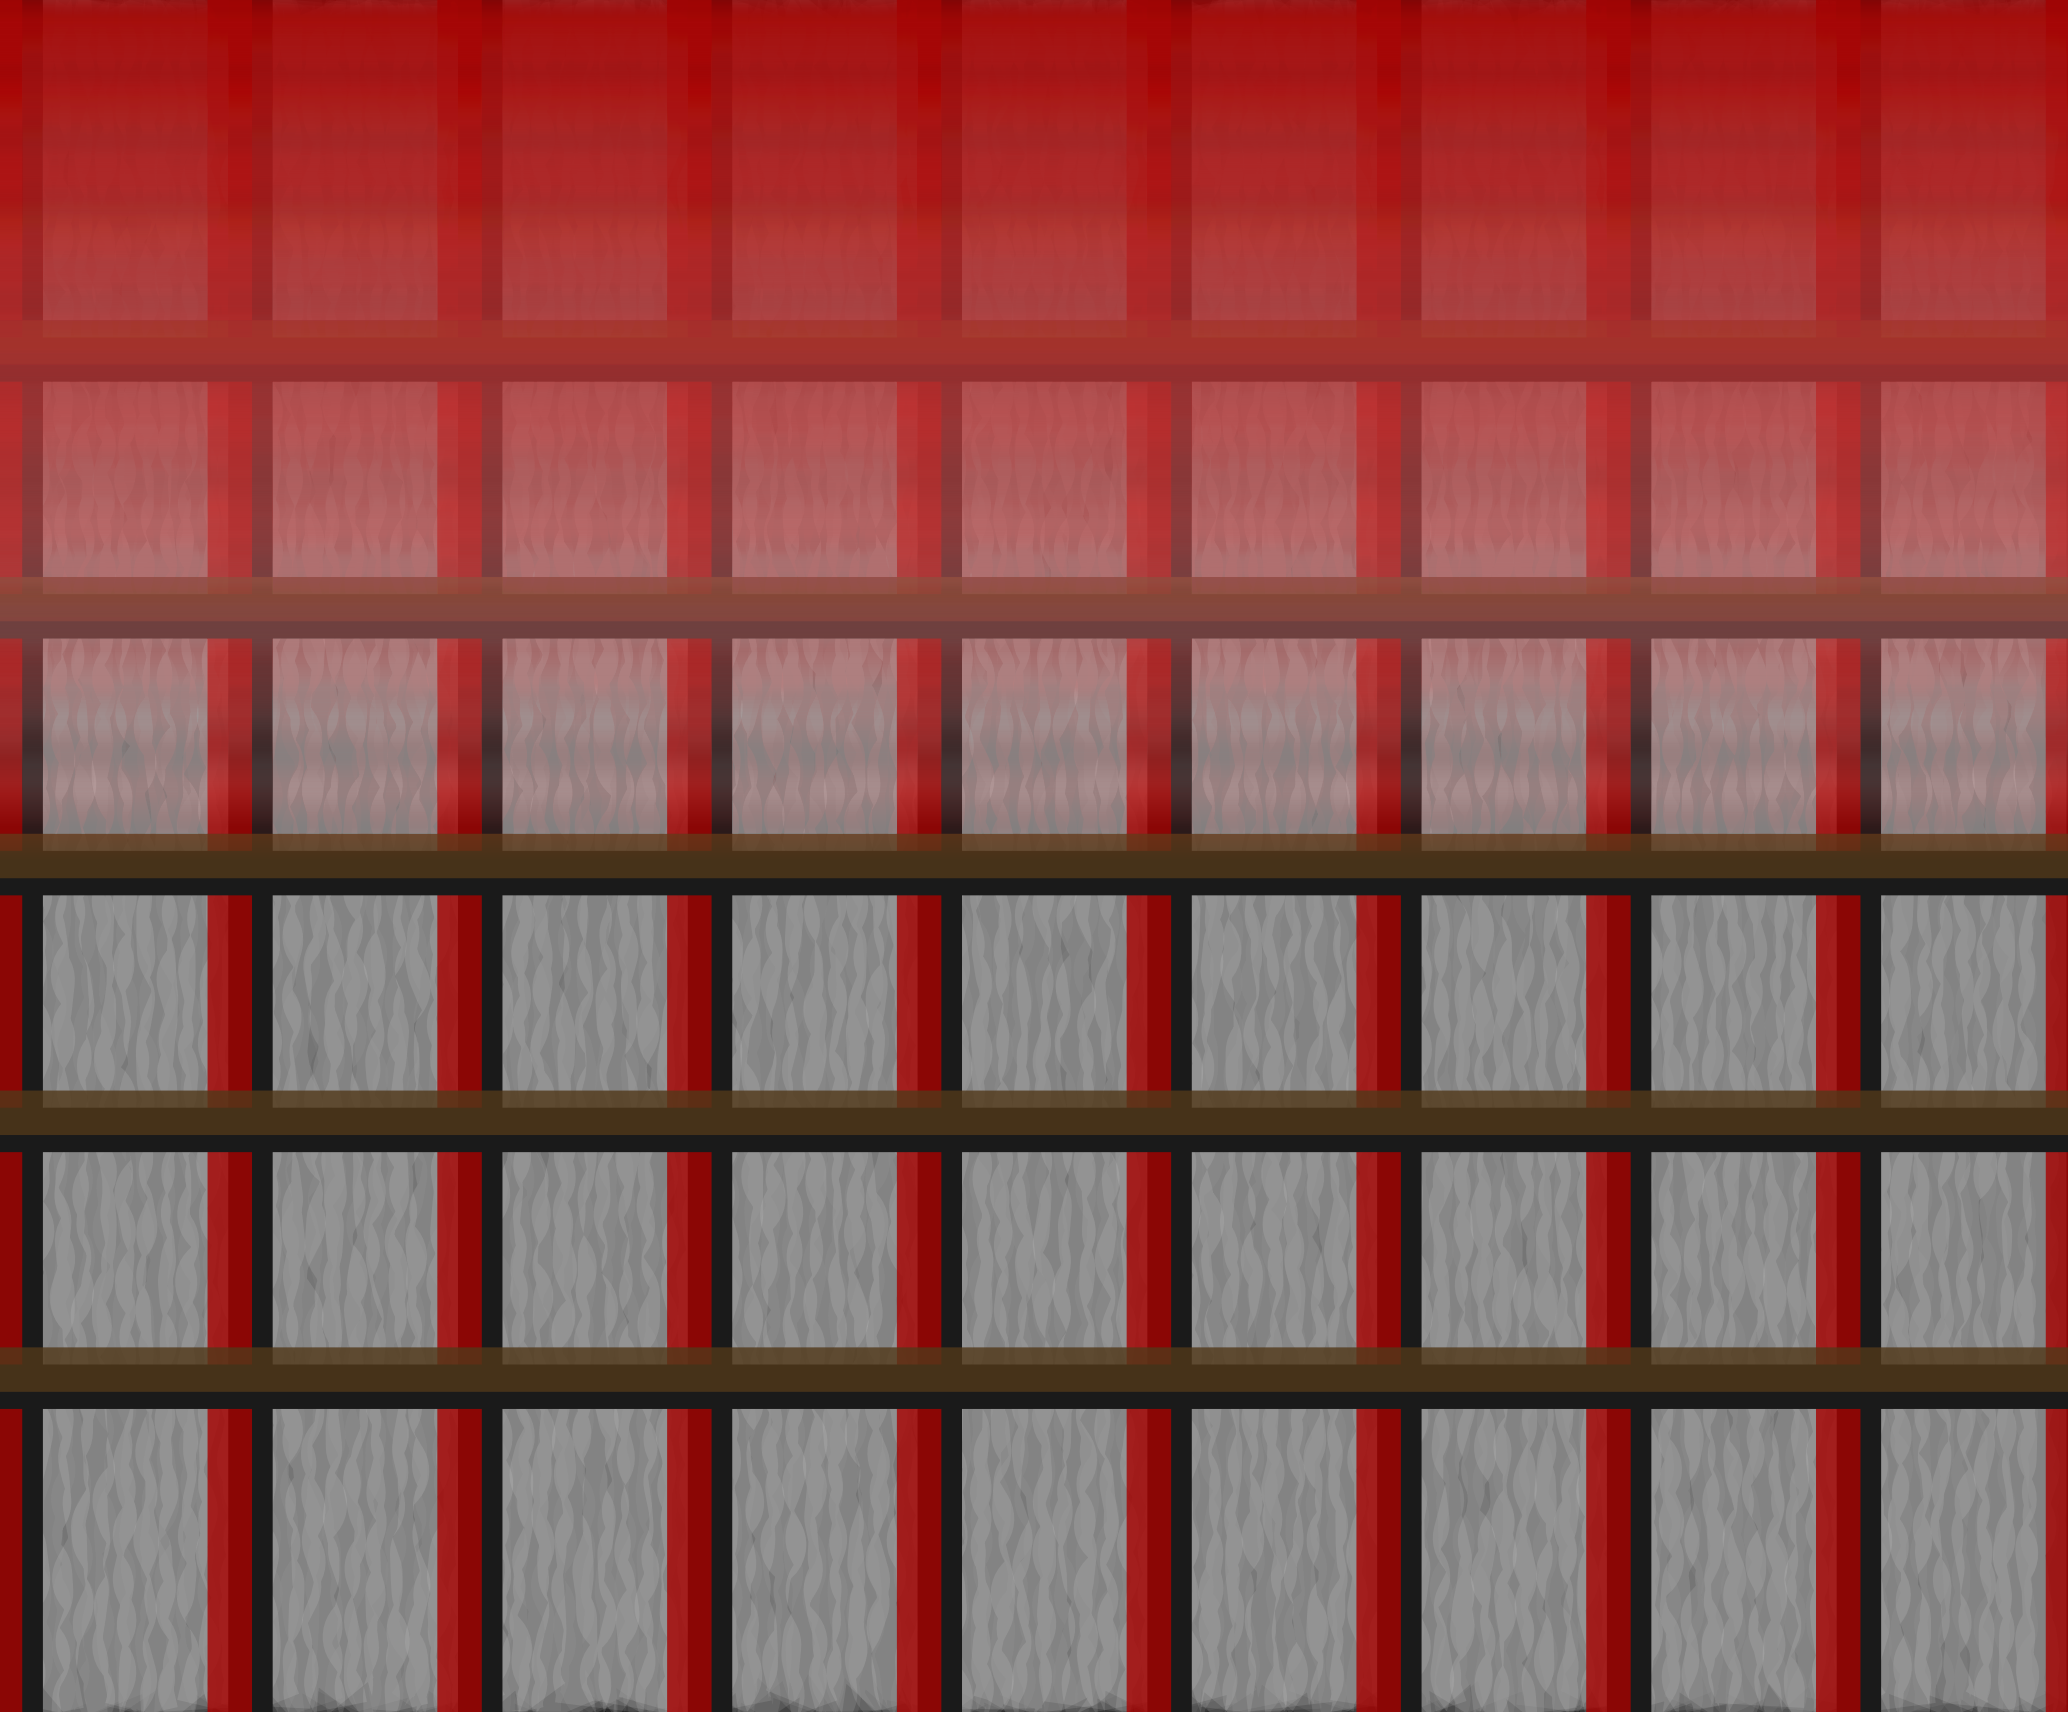
#Picking out colors to use#
burberry_colors <- c("#A70100", "#513819", "#956226", "#747674", "#0D100E", "#ffffff")
#Background color
back_color <- "#B8A081"
#Vertical Lines#
red_lines <- tibble(x = seq(0,10, length = 10),
xend = x,
y = 0,
yend = 10,
group = "redlines")
#Horizontal Lines#
tan_lines <- tibble(y = seq(2,8, length = 5),
yend = y,
x = 0,
xend = 10,
group = "tan lines")
#Background waves#
texture <- tibble(x = seq(0,10, length = 100),
y = x) |>
expand.grid()
#Red Fog#
textbar <- tibble(x = 0,
xend = 10,
y = seq(10,0, length = 1000),
yend = y,
group = "textbar",
color = colorRampPalette(c("#A70100", "#ffffff"))(1000))
red_lines |>
ggplot(aes(x,y, group = group))+
theme_void()+
theme(plot.background = element_rect(fill = back_color))+
geom_path(data = texture, aes( group = x),
linewidth= 15,
color = "#000000",
alpha = 1, position = position_jitter(width = .05))+
geom_path(data = texture, aes( group = x),
linewidth= 10,
color = "#555555",
alpha = .3,
position = position_jitter(width = .05))+
geom_path(data = texture, aes( group = x),
linewidth= 10,
color = "#ffffff",
alpha = .1,
position = position_jitter(width = .05))+
geom_segment(aes(x = (x +.1), xend = (xend + .1), yend = yend),
color = "#1a1a1a",
linewidth = 5)+
geom_segment(aes(xend = xend, yend = yend),
color = burberry_colors[1],
alpha = .8,
linewidth = 5)+
geom_segment(data = tan_lines, aes(y = (y -.1), xend = xend, yend = yend - .1),
color = "#1a1a1a",
linewidth = 5)+
geom_segment(data = tan_lines, aes(xend = xend, yend = yend),
color = burberry_colors[2],
alpha = .8,
linewidth = 5)+
geom_segment(data = textbar, aes(xend = xend, yend = yend),
color = textbar$color,
alpha = c(seq(.1,0, length = 500),rep(0,500)),
linewidth = 5)+
coord_cartesian(xlim = c(0,10), ylim = c(0,10), expand = FALSE)