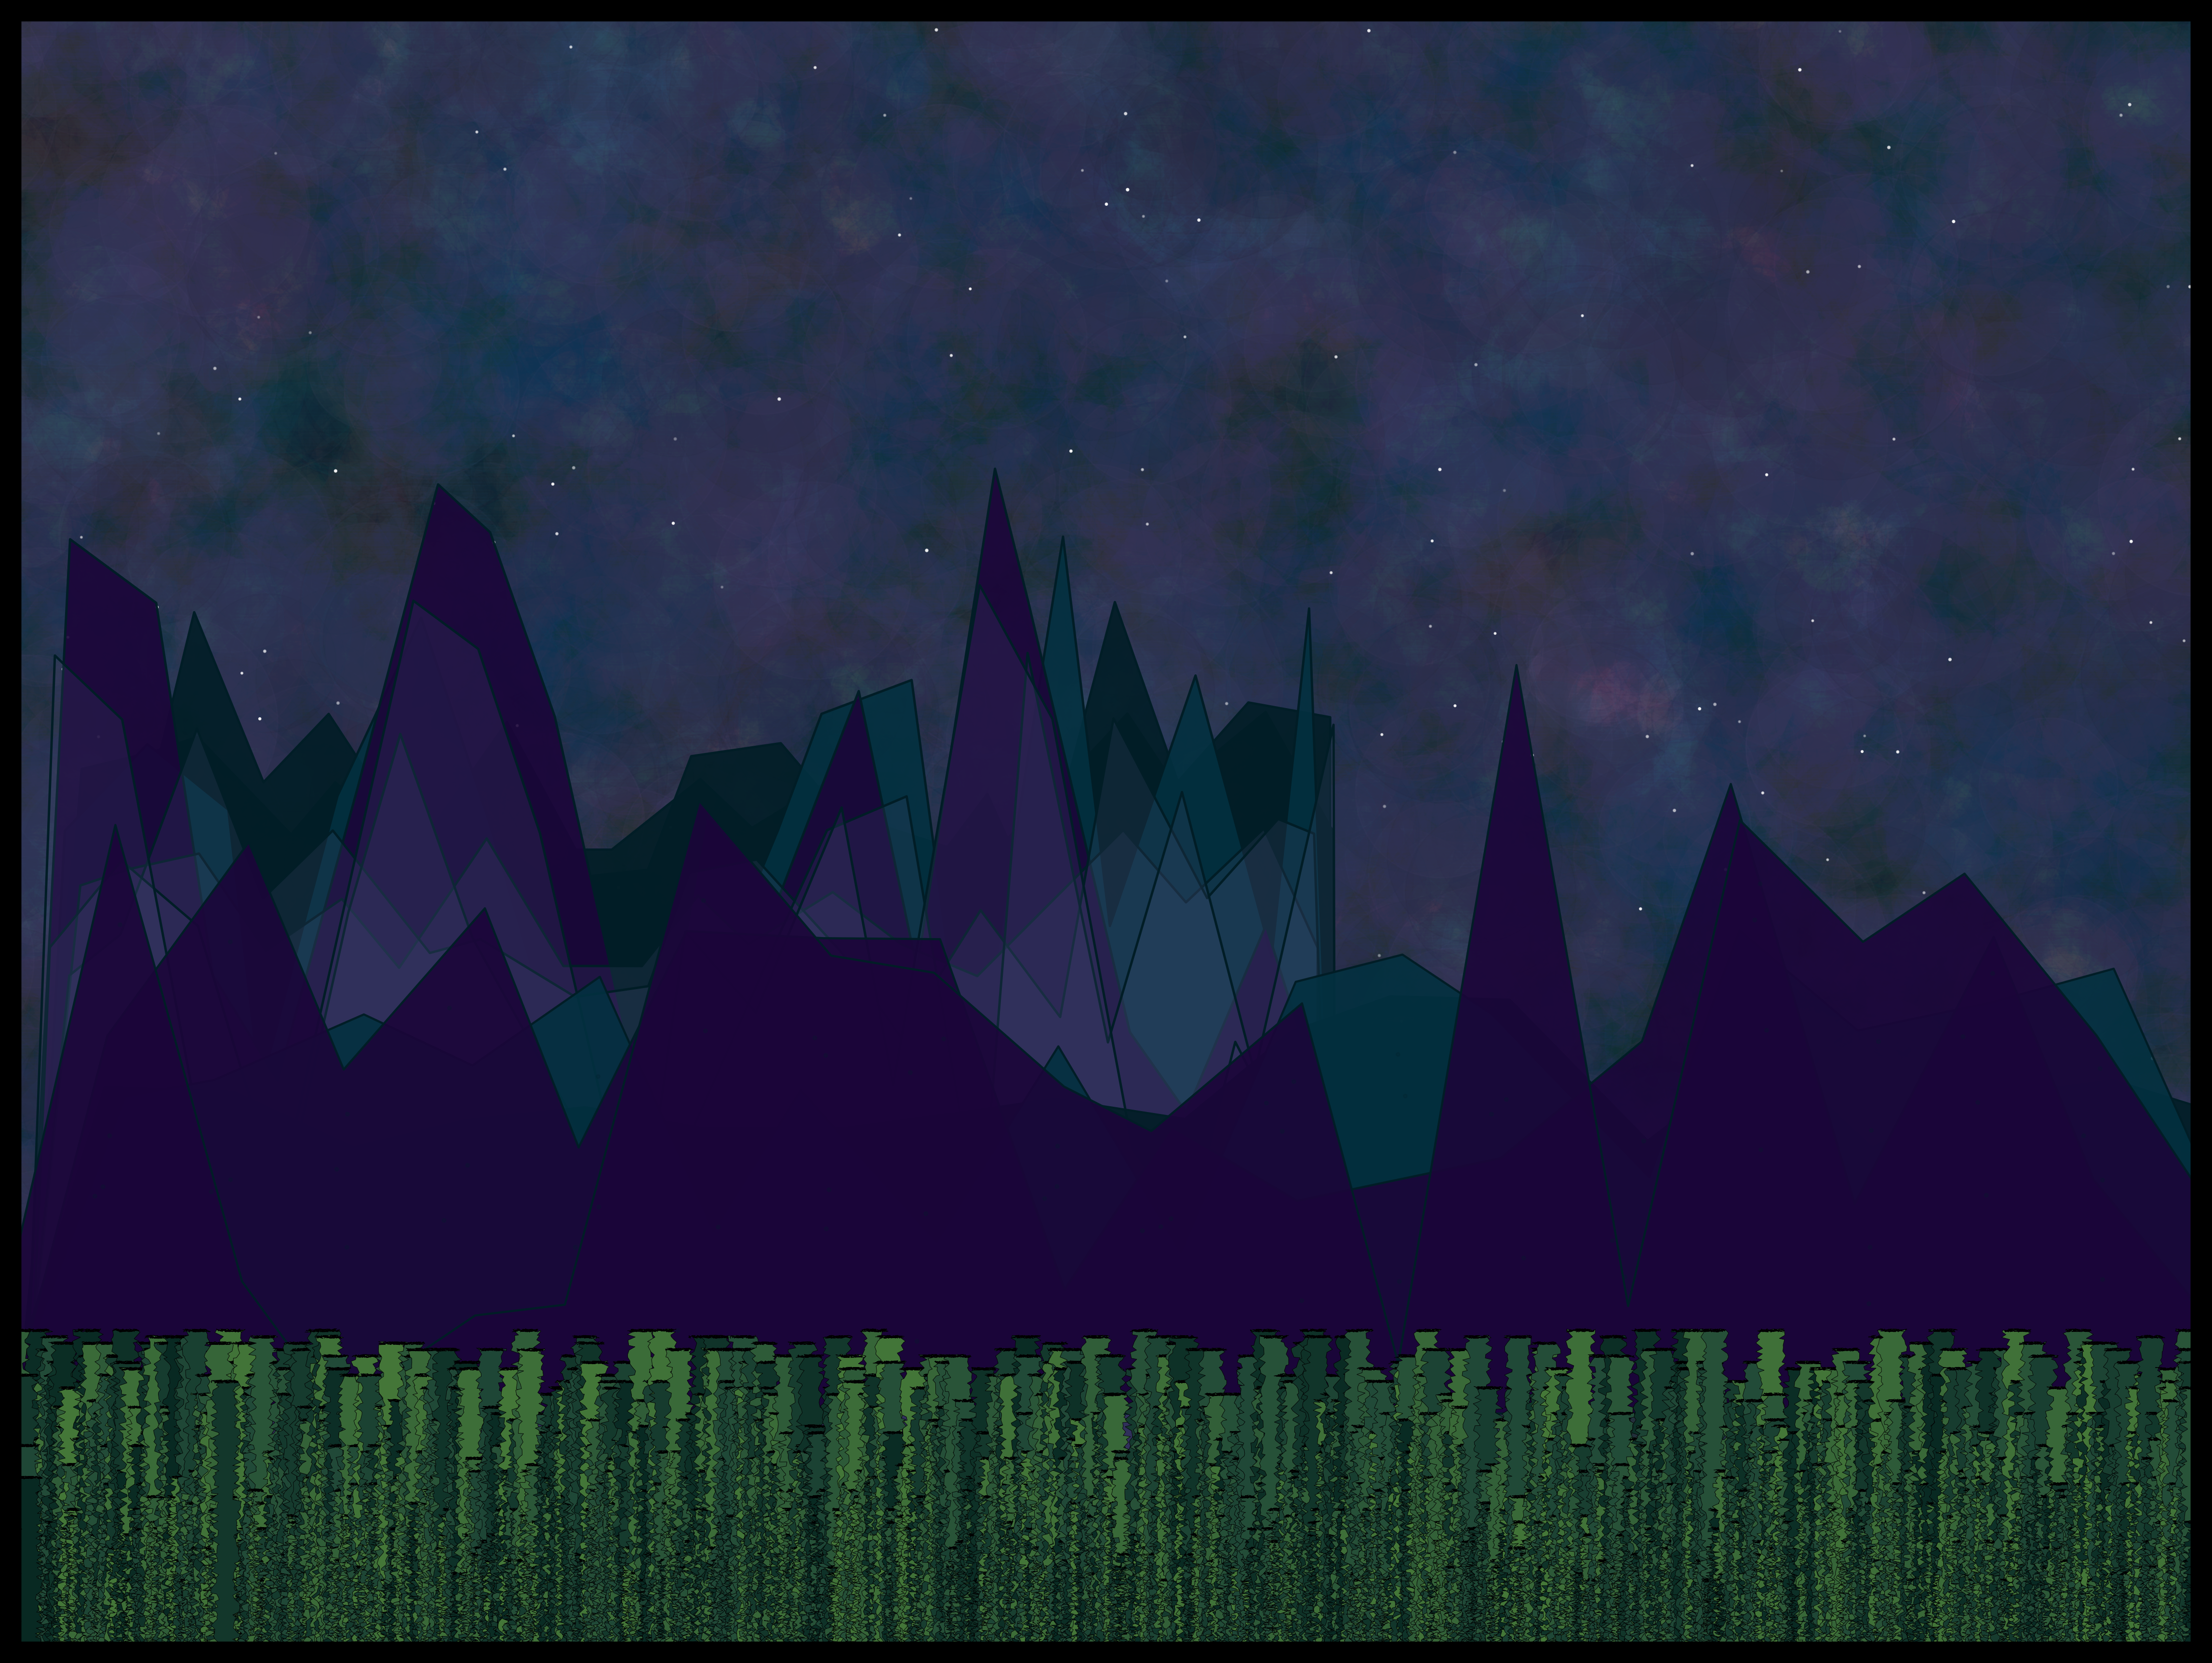
#=============================================================================##Library Load-in---------------------------------------------------------------#=============================================================================#library(dplyr)library(purrr)library(ggplot2)#=============================================================================##Data Set-up-------------------------------------------------------------------#=============================================================================##Sky (Nebula) data#sky <-tibble(x =seq(0,10, length =100),y =seq(0,10, length =100)) |>expand.grid() #Setting a color palette for the sky in the background===sky_pal <-sample(colorRampPalette(c(rep("#000000",3),rep("#1A0539",5), "#c66c92","#836193","#434a73","#439895","#046c8e",rep("#042047",3)))(nrow(sky)))sky_size <-sample(15:35, nrow(sky), replace =TRUE)sky_texture <- sky |>mutate(color = sky_pal,size = sky_size,group ="sky")#====Stars Data====stars_grid <-tibble(expand.grid(x =seq(0,10, length.out =100),y =seq(0,10, length.out =100))) stars <-slice_sample(stars_grid, n =200) |>mutate(group ="stars")#====Mountains Data/Functions/Palettes====# Function that creates one set of mountains====#THIS IS AN OLD FX I'M NOT MAKING THIS MORE EFFICIENT IDC I'M TIRED 🗣 mountain_ranger <-function(base,height,rows){#Creating the first foundation the function will build off of== foundation <-tibble(x =c(0, base, seq(base,0, length.out =20)),y =c(0, 0, height, height+sample(seq(-.2,.8,length.out =100),18, replace =TRUE), 0))#Creating an empty list to store the data for the generated mountain ranges== mountains <-list()#Using a for-loop to iterate through the data to create the correct number of rows/ranges we want==for(i inseq_along(1:rows)){ mountains[[i]] <- foundation %>%mutate(y =abs(y +c(0, 0, i*(sample(seq(-.8,.8,length.out =100), nrow(foundation) -3)), 0)),group = i) }#Adding the "group" variable to our original foundation that was created earlier== foundation <- foundation %>%mutate(group =0)#Binding the generated mountain data together== mountains <-bind_rows(mountains)#Binding the generated mountain data and the foundation data together into one data frame== range <-rbind(foundation,mountains)#Returning the data frame to the environment==return(range)}#Using the custom function to make two sets of ranges===range <-mountain_ranger(6,5,3)range2 <-mountain_ranger(10,1.8,3)#Calculating the total amount of ROWS located within EACH group in each set of ranges==group_n <-nrow(range)/length(unique(range$group))group_n2 <-nrow(range2)/length(unique(range2$group))#Calculating the TOTAL number of GROUPS within each set of ranges==group_total <-length(unique(range$group))group_total2 <-length(unique(range2$group))# Colors for the first range data set==mountain_pal_range <-sort(rep(sample(c("#011d26","#02303f","#1c5a73","#4a748c","#1A0539","#836193"),group_total, replace =TRUE), each = group_n))# Colors for the second range data set==mountain_pal_range2 <-sort(rep(sample(c("#011d26","#02303f","#1c5a73","#4a748c","#836193",rep("#1A0539",4)),group_total2, replace =TRUE), each = group_n2))#====Trees Data/Functions/Palettes====#Creating tree options#x_trans <-seq(0,9.9, by = .1)y_trans <-sample(seq(-.8,.5, length =30), length(x_trans), replace =TRUE)tree_pal <-sample(colorRampPalette(c("#224b39", "#3D6E38", "#082922"))(length(x_trans)))tree_opts <-list(x_trans, y_trans, tree_pal)#Creating tree data#trees <-pmap_df(tree_opts, ~tibble(x =c(0,.1,rep(.1,100), .1,0,rep(0,100)),y =c(0,0,seq(0,1.5+ ..2, length =100),1.5+ ..2, 1.5+ ..2,seq(1.5+ ..2,0, length =100)),group ="tree_") |>mutate(x = x + ..1,group =paste0(group,..1),fill = ..3))#====Frame Data====# Just our x and y limits#frame <-tibble(x =c(0,10,10,0,0),y =c(0,0,10,10,0),group ="frame")#=============================================================================##Final Piece-------------------------------------------------------------------#=============================================================================#sky_texture %>%ggplot(aes(x=x,y=y, group = group)) +theme_void()+theme(panel.background =element_rect(fill ="#000000"))+geom_point(color = sky_texture$color,size = sky_texture$size,alpha = .02) +geom_point(data = stars, color ="#ffffff",position =position_jitter(width =.05, height = .03), alpha =sample(seq(.2,.9, length.out =1000),nrow(stars), replace =TRUE),size =sample(seq(.02,.2, length.out =1000),nrow(stars), replace =TRUE))+geom_polygon(data = range, fill = mountain_pal_range,color ="#011D26", linewidth =.56,alpha = .9, position =position_jitter(width = .1)) +geom_polygon(data = range2, fill =rev(mountain_pal_range2),color ="#011D26", linewidth =.5,alpha = .9, position =position_jitter(width = .1)) +geom_polygon(data = range2, aes(y = y - .4),fill ="#836193",color ="#011D26", linewidth =.5,alpha = .5, position =position_jitter(width = .1)) +geom_polygon(data = trees, color ="#082922", linewidth = .1, fill = trees$fill,position =position_jitter(width = .03))+geom_path(data = frame, color ="#000000", linewidth =10, position =position_jitter(width = .1, height = .1))+coord_cartesian(xlim =c(0,10), ylim =c(0,10), clip ="on",expand =FALSE)