#=============================================================================#
#Library Load-in---------------------------------------------------------------
#=============================================================================#
library(dplyr) #For data manipulation
library(purrr) #For list manipulation/iterations
library(ggplot2) #For Plotting
#=============================================================================#
#Data Set-up-------------------------------------------------------------------
#=============================================================================#
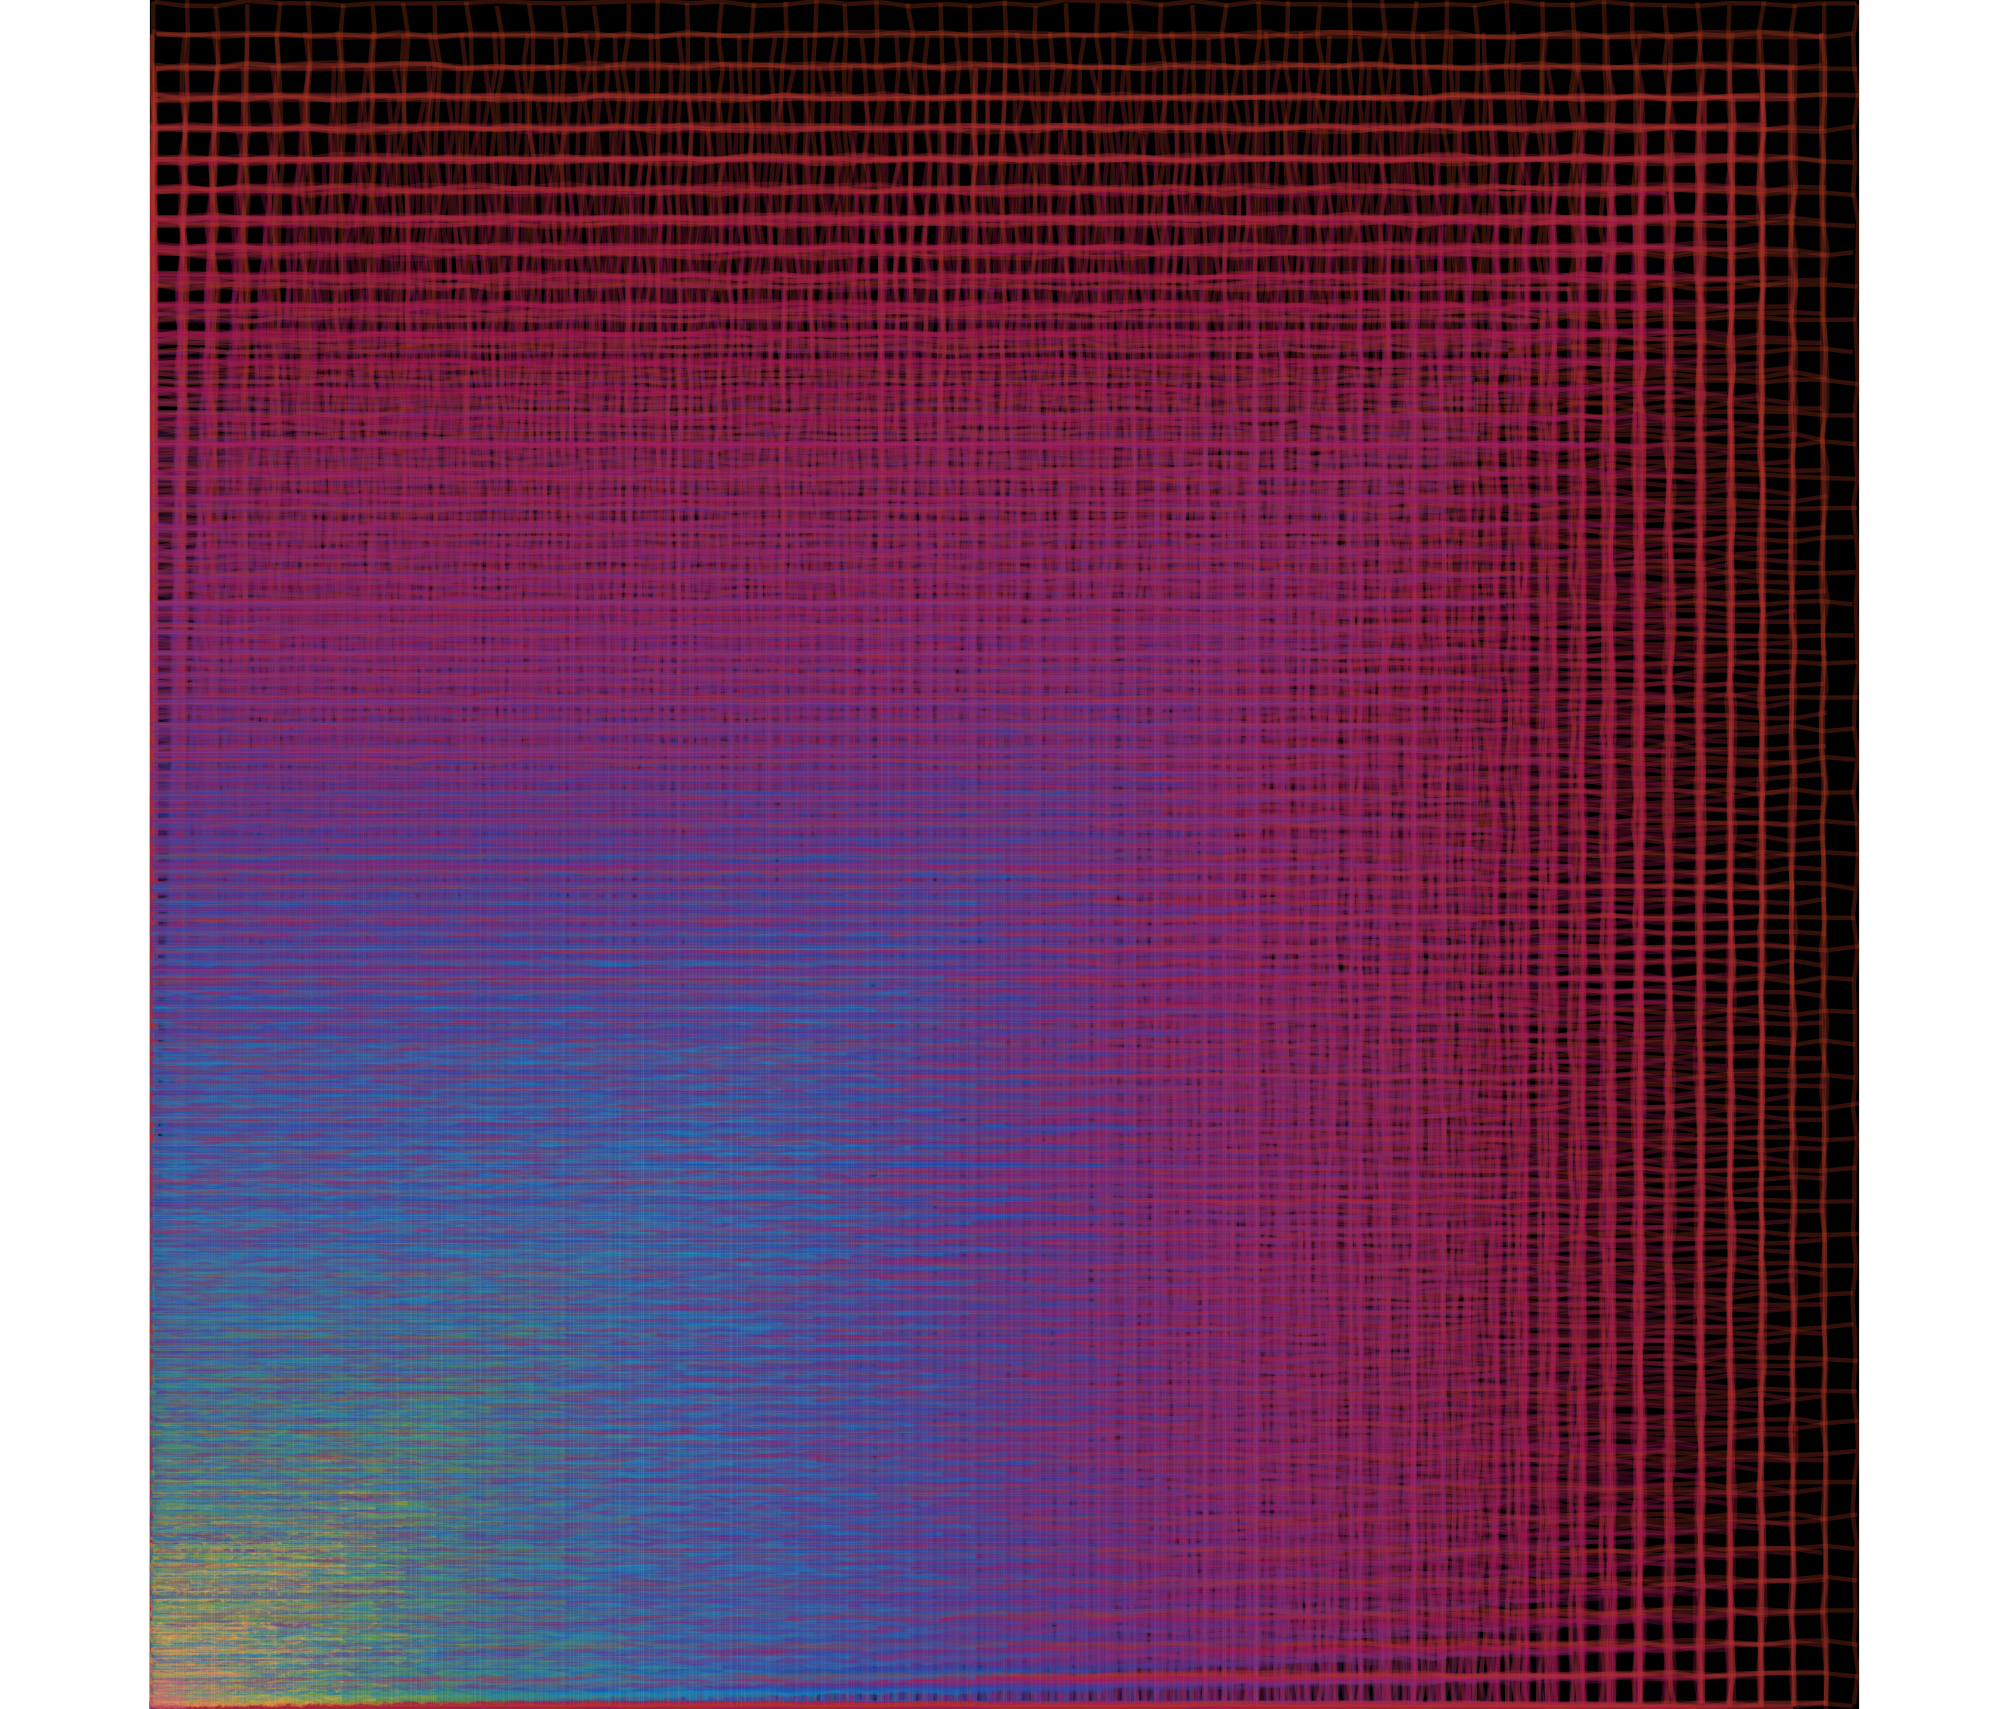
#Number of grids in total#
n = 55
#X scale transformations
var_trans <- seq(0,10, length.out = n)
#Compiling grids
grid_data <- map2_df(var_trans, n, ~ tibble(x = seq(0,(.5)*..1, length.out = ..2),
y = x) |>
expand.grid())
#Adding color palette to grid data#
grid_data_color <- grid_data |>
mutate(color = colorRampPalette(rev(c("#af3918", "#a21152", "#822b75",
"#612884","#154baf","#0b82b9",
"#277e9d","#488e35","#e3a934",
"#b2336a")))(nrow(grid_data))
)
#=============================================================================#
#Final Piece-------------------------------------------------------------------
#=============================================================================#
grid_data_color |>
ggplot(aes(x,y))+
theme_void()+
theme(plot.background = element_rect(fill = "black"))+
geom_path(aes(group = x),
alpha = .3,
color = grid_data_color$color,
position = position_jitter(width = .01, height = .01))+
geom_path(aes(group = y),
alpha =.3,
color = grid_data_color$color,
position = position_jitter(width = .01, height = .01))+
geom_path(aes(group = x),
alpha = .03,
color = "white",
linewidth = .03)+
geom_path(aes(group = y),
alpha = .03,
color = "white",
linewidth = .03)+
coord_equal(expand = FALSE)
# ggsave("images/17.png",
# device = "png",
# dpi = 300,
# bg = "transparent")