#=============================================================================#
#Lbrary Load-in----------------------------------------------------------------
#=============================================================================#
library(dplyr) #Data Wrangling
library(purrr) #List manipulation/iteration
library(ggplot2) #Plotting
#=============================================================================#
#Data Set-up-------------------------------------------------------------------
#=============================================================================#
#number of waves#
n = 1000
#Limits of the page#
xmin <- 0
xmax <- 20
ymin <- 0
ymax <- 10
#Color Options#
sky_colors <- colorRampPalette(c("#94A4C4", "#98BFDE", "#2C8ED1", "#2F9DE2", "#2063A5"))(n)
water_colors <- colorRampPalette(c("#016ADF", "#0086E0", "#57E2DD", "#00A7B2", "#1095A6", "#016074","#08389E", "#001247"))(n)
#Wave Compilation#
wave_part <- tibble(x = seq(xmin, xmax, length.out = n),
y = sin(x)/10)
wavex <- rep_along(1:n, seq(-10,10, length.out = 100))
wavey <- seq(0,3, length.out = n)
wave_opts <- list(wavex,
wavey,
water_colors,
1:n)
#=============================================================================#
#Data Compilation--------------------------------------------------------------
#=============================================================================#
waves <- pmap_df(wave_opts, ~ wave_part |>
mutate(x = x + jitter(..1, amount = 3),
y = y + jitter(..2, amount = .2),
color = ..3,
group = paste0("wave_",..4)))
#Sky Data#
sky_slice <- tibble(x = seq(0,20, length.out = n),
y = 2.5)
skyy <- seq(0,8.5, length.out = n)
sky <- map2_df(skyy, sky_colors, ~sky_slice |>
mutate(y = y + .x,
color = .y,
group = "sky"))
#Cloud Data#
x_end <- c(5,11,20)
ybottom <- c(6,6.5,7)
ytop <- c(8.5,8,7.5)
cloud_opts <- list(x_end,ybottom,ytop)
cloud_box <- pmap_df(cloud_opts, ~tibble(x = seq(0,..1, length.out = 20),
y = seq(..2, ..3, length.out = 20),
group = "cloud") |>
expand.grid())
#Colors for clouds#
grays <- colorRampPalette(c("#666666", "#ffffff"))(nrow(cloud_box))
#Overall texture#
texture <- tibble(x= seq(xmin,xmax, length.out = 20),
y = seq(ymin,ymax, length.out = 20),
group = "texture") |>
expand.grid()
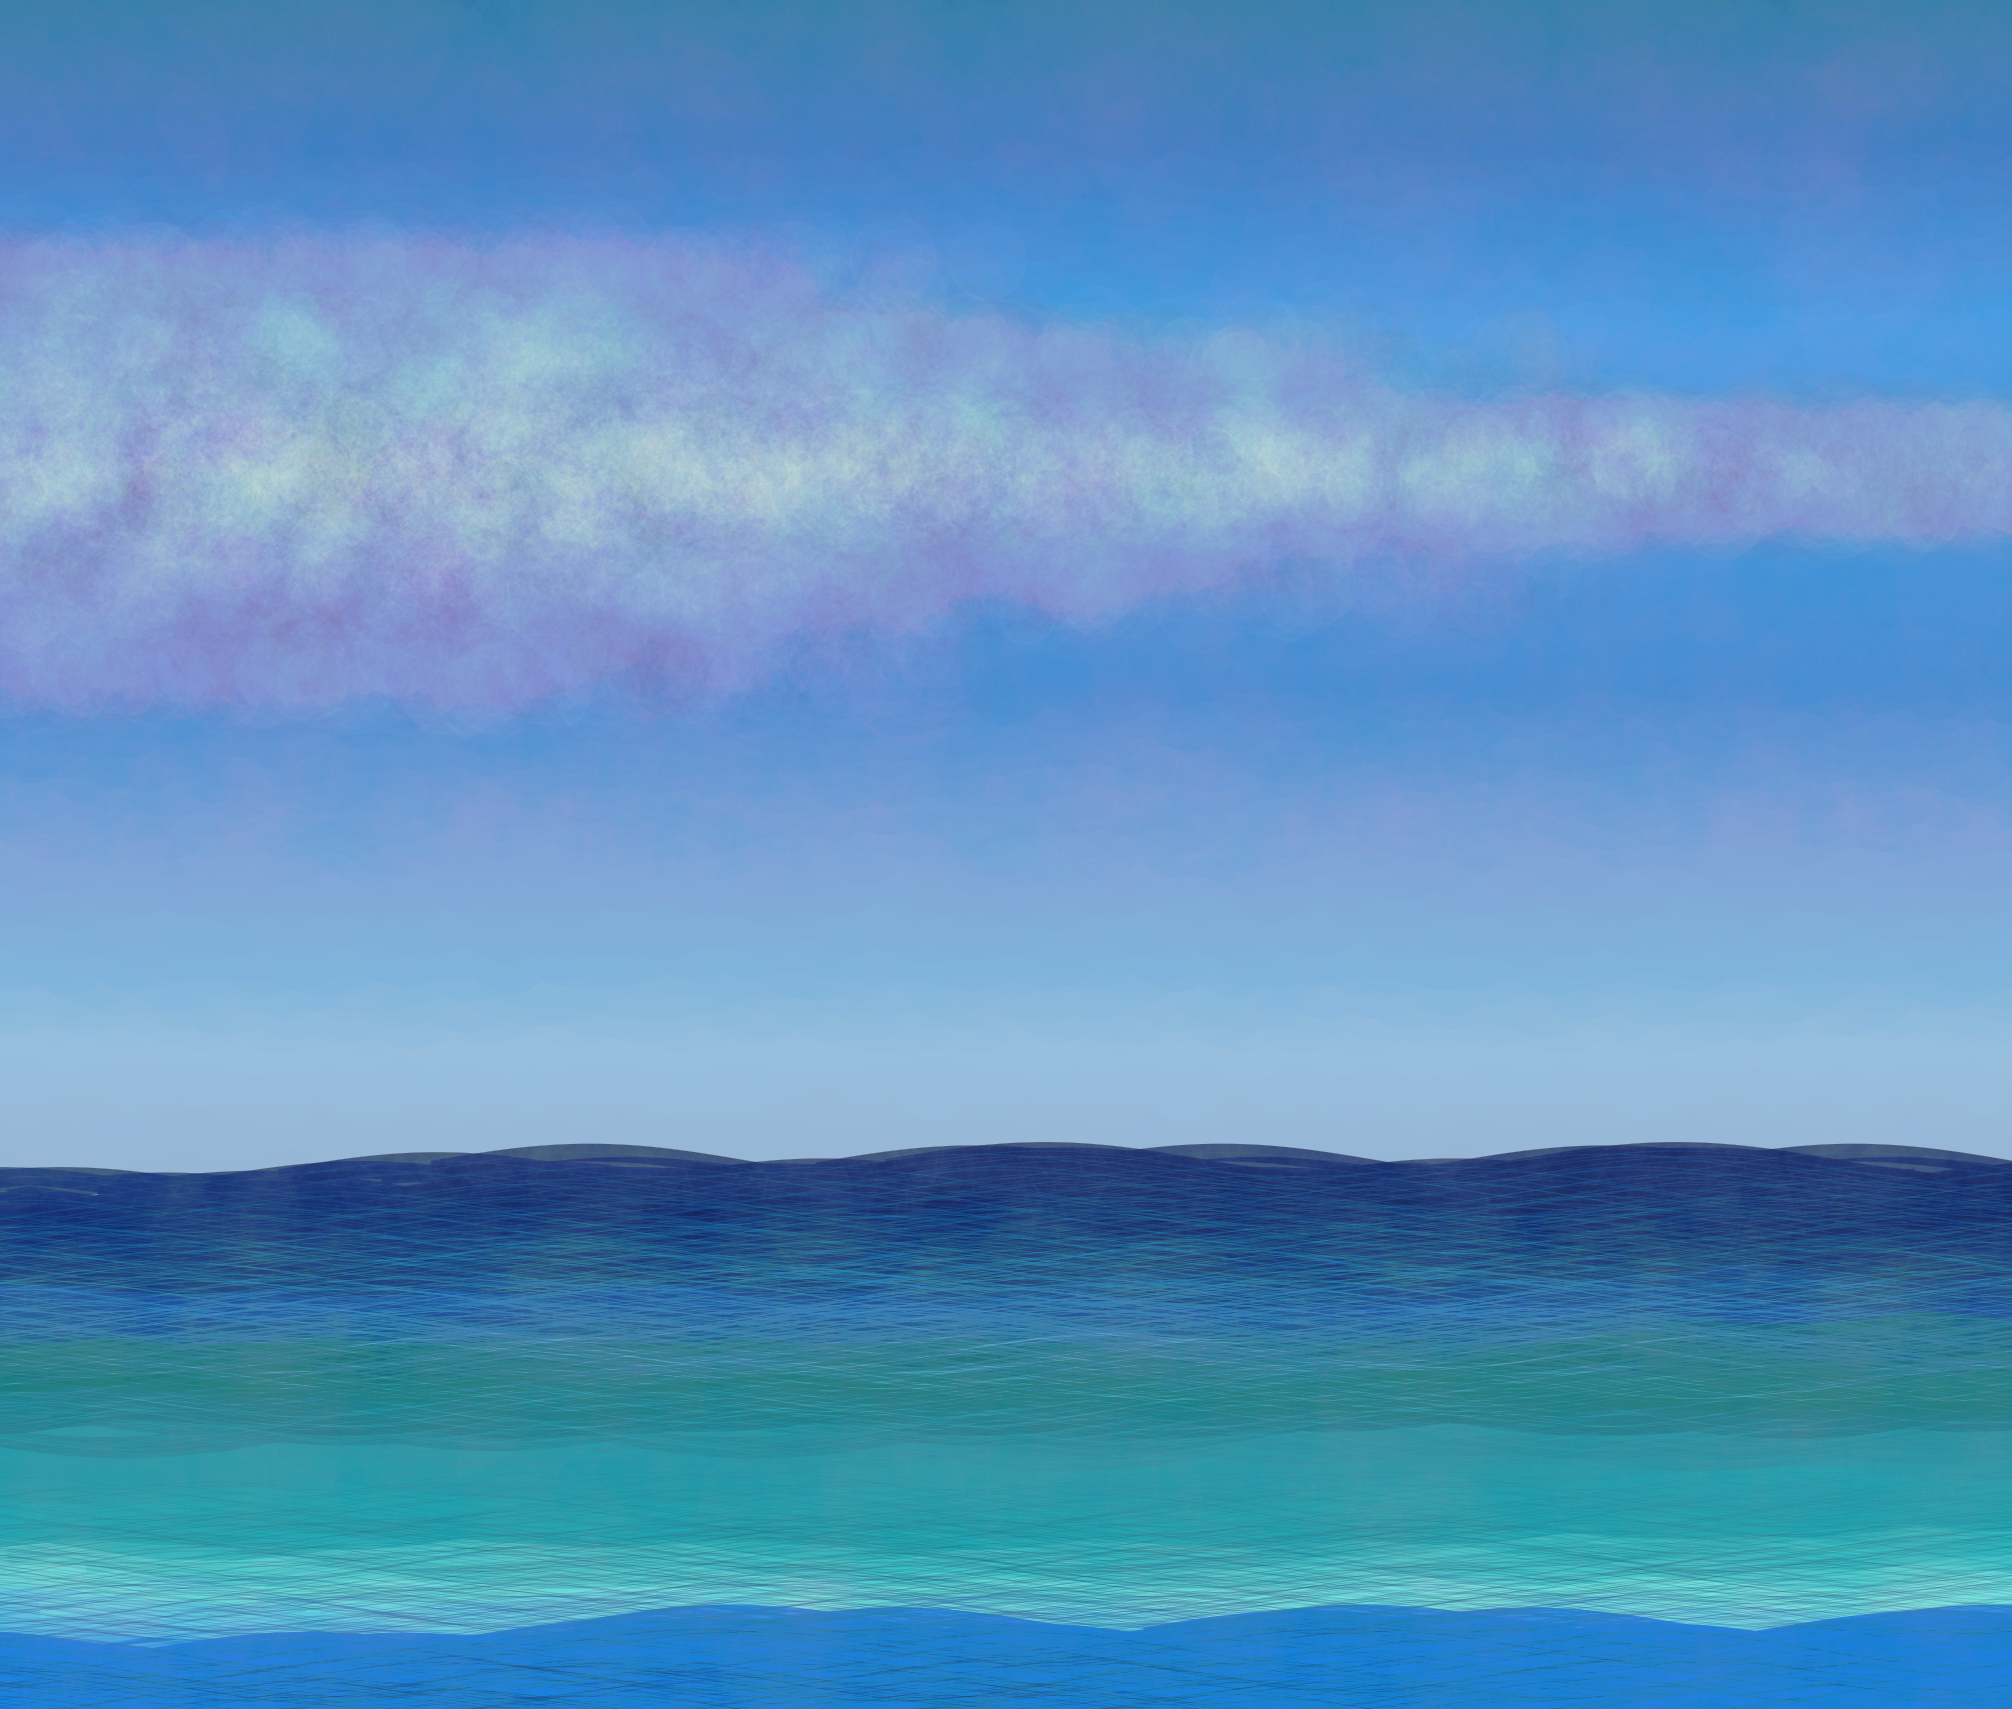
#=============================================================================#
#Final Piece-------------------------------------------------------------------
#=============================================================================#
waves |>
ggplot(aes(x,y, group = group))+
theme_void()+
geom_point(data = sky,
color = sky$color,
position = position_jitter(width = .4, height = .6),
size = sample(seq(.1,10, length.out = 25), nrow(sky), replace = TRUE))+
geom_path(color = waves$color,
linewidth = 2,
alpha = .8)+
geom_path(color = rev(waves$color),
linewidth = .1,
alpha = .2)+
geom_point(data = cloud_box,
size = sample(seq(5,10, length.out = 30), nrow(cloud_box), replace = TRUE),
alpha = .01, position = position_jitter(width = 5, height = .1),
color = sample(grays)) +
geom_point(data = texture,
size = sample(seq(10,20, length.out = 50), nrow(texture), replace = TRUE),
alpha = .002, color = "#ffffff",
position = position_jitter(width = .5, height = .4))+
coord_cartesian(xlim = c(xmin,xmax),
ylim = c(ymin,ymax),
expand = FALSE)
#To save the output:
# ggsave("images/15.png",
# dev = "png",
# dpi = 300)