#=============================================================================#
#Library Load-in---------------------------------------------------------------
#=============================================================================#
library(dplyr)
library(purrr)
library(sp)
library(ggplot2)
#=============================================================================#
#Data Set up-------------------------------------------------------------------
#=============================================================================#
#Data for vertical lines#
vert <- tibble(x = c(seq(0,.1, length.out = 100),
rep(.1, 100),
seq(.1,0, length.out = 100),
rep(0, 100)),
y = c(rep(0,100),
seq(0,10, length.out = 100),
rep(10, 100),
seq(10,0, length.out = 100)),
group = rep("vert", 400)
)
#Data for horizontal lines#
horiz <- tibble(x = c(seq(0,10, length.out = 100),
rep(10, 100),
seq(10,0, length.out = 100),
rep(0, 100)),
y = c(rep(0,100),
seq(0,.1, length.out = 100),
rep(.1, 100),
seq(.1,0, length.out = 100)),
group = rep("horiz", 400)
)
#Setting angles for circles#
theta <- seq(0,2*pi, length.out = 100)
#Creating the first circle#
circles <- tibble(x = cos(theta) * 5,
y = sin(theta) * 5)
#And the second#
circles2 <- circles |>
mutate(x = x + 10,
y = y + 10)
#Setting transformations for lines#
trans <- seq(0,10, by = .15)
#Vertical data#
verts <- map_df(trans, ~vert |>
mutate(x = x + .x,
group = paste0(group,.x))) |>
mutate(logic = point.in.polygon(x,y, circles$x, circles$y),
logic2 = point.in.polygon(x,y, circles2$x, circles2$y)) |>
filter(logic == 0 & logic2 == 0)
#Horizontal data for circle 1#
horiz1 <- map_df(trans, ~horiz |>
mutate(y = y + .x,
group = paste0(group,.x))) |>
mutate(logic = point.in.polygon(x,y, circles$x, circles$y)) |>
filter(logic == 1)
#And circle 2#
horiz2 <- map_df(trans, ~horiz |>
mutate(y = y + .x,
group = paste0(group,.x))) |>
mutate(logic = point.in.polygon(x,y, circles2$x, circles2$y)) |>
filter(logic == 1)
#Overall texture overlay#
texture <- tibble(x = seq(0,10, length.out = 100),
y = x) |>
expand.grid()
#=============================================================================#
#Final Piece-------------------------------------------------------------------
#=============================================================================#
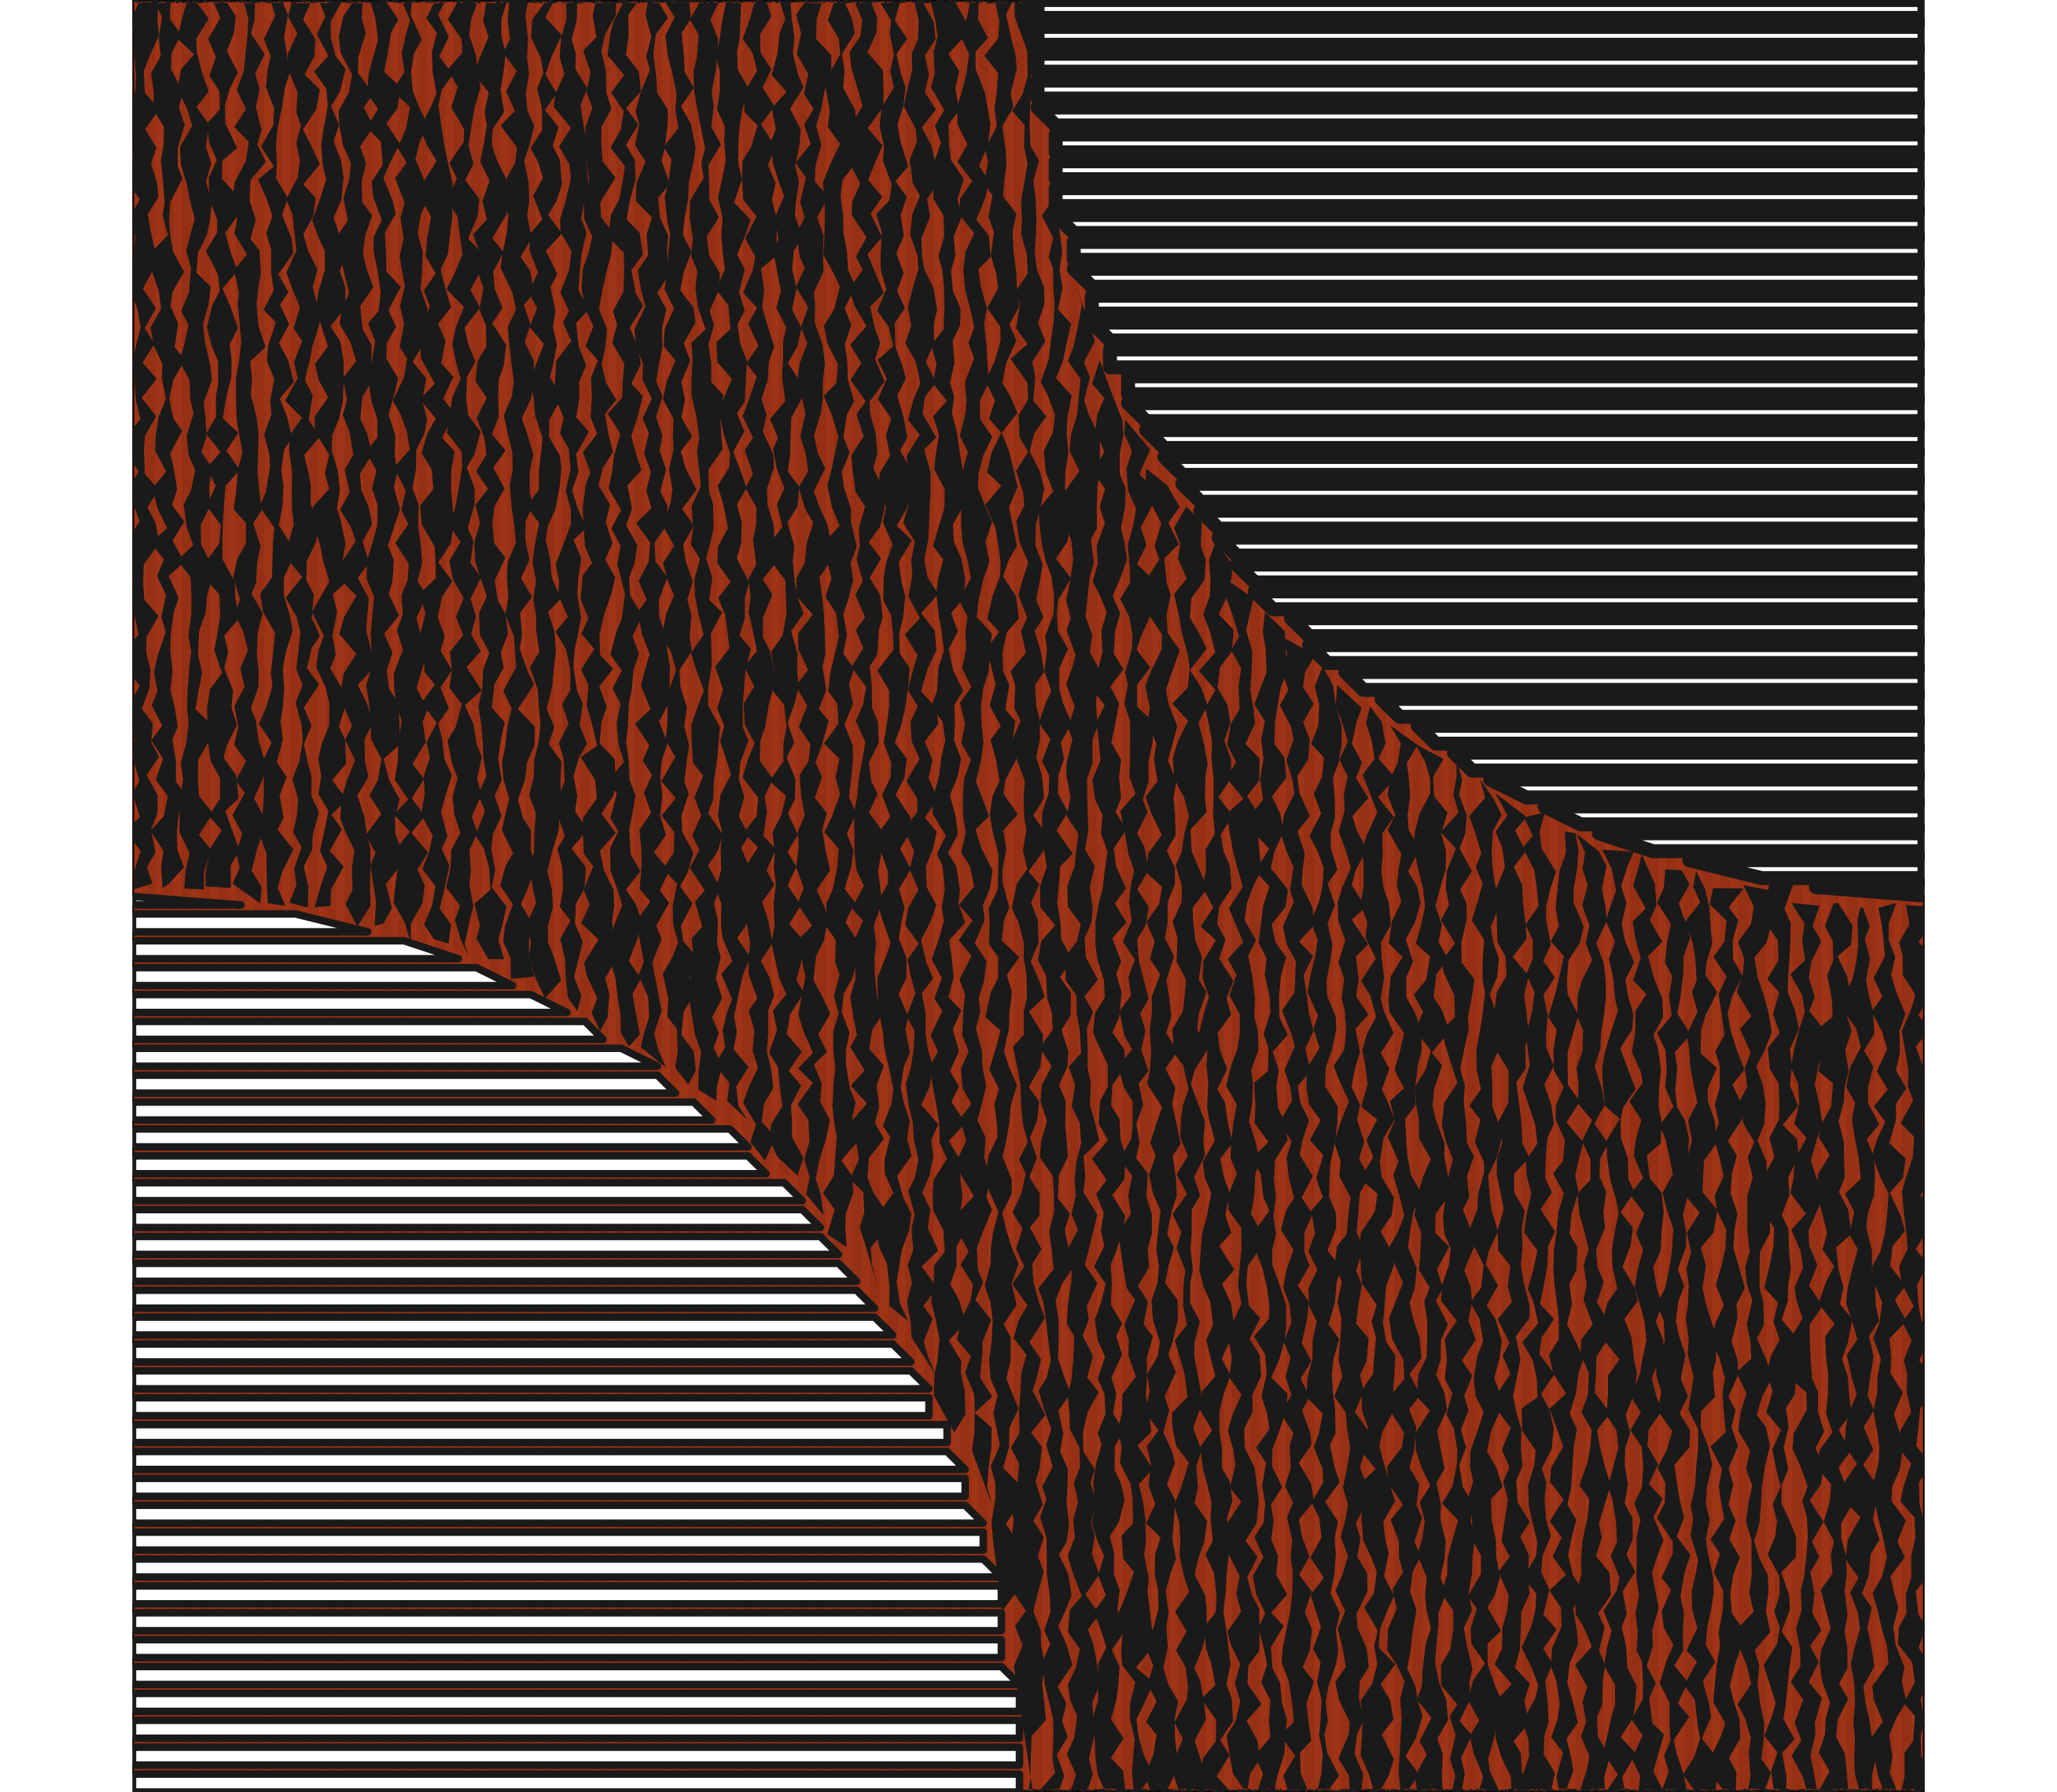
verts |>
ggplot(aes(x,y, group = group))+
theme_void() +
theme(plot.background = element_rect(fill = "#af3918"))+
geom_path(data = texture, aes(x,y,group = x),
inherit.aes = FALSE,
linewidth = 5,
alpha = .05)+
geom_polygon(color = NA,
fill = "#1a1a1a",
position = position_jitter(width = .05, height = .02),
linewidth = .5)+
geom_polygon(data = horiz1,
fill ="#ffffff",
color = "#1a1a1a",
linewidth = .8)+
geom_polygon(data = horiz2,
fill = "#ffffff",
color = "#1a1a1a",
linewidth = 1.5)+
coord_equal(xlim = c(0,10),
ylim = c(0,10),
expand = FALSE)
#To save output:
# ggsave("11.png",
# bg = "transparent",
# device = "png",
# dpi = 400)