#=============================================================================#
#library Load-in---------------------------------------------------------------
#=============================================================================#
library(dplyr) #For data wrangling/manipulation
library(purrr) #For iterations/list handling
library(ggplot2) #For Plotting
#=============================================================================#
#Data and color Set up----------------------------------------------------------
#===========================================================================#
#Colors#
blues <- c("#06273A", "#1A374D", "#335172", "#6B869B", "#BFCBD3", "#FFFFFF")
red <- "#F1371B"
#Limit Setting#
xmin <- 0
ymin <- 0
xmax <-15
ymax <- 25
#Specs for grid data#
#Counts for the grid#
square_n <- 5
n <- 75
#grid transformations#
x_trans <- seq(xmin,xmax, length.out = 100)
y_trans <- seq(ymin,ymax, length.out = 100)
#grouping/color specs#
groupn_row <- length(x_trans) * square_n * length(y_trans)
color_n <- groupn_row/5
square_colors <- colorRampPalette(blues)(color_n)
border_colors <- map_chr(square_colors, ~colorRampPalette(c(.x, "#ffffff"))(10)[7])
#Grid compilation#
square <- tibble(x = c(0,1,1,0,0),
y = c(0,0,1,1,0))
square_row <- map_df(x_trans, ~square |>
mutate(x = x + .x))
square_grid <- map_df(y_trans, ~square_row |>
mutate(y = y + .x))
square_grid$fill <- rep(square_colors, each = 5)
square_grid$color <- rep(border_colors, each = 5)
square_grid$group <- rep(paste0("group", 1:color_n), each = 5)
#Polygon/building work#
level1 <- sample(seq(23,20, length.out = 20), n, replace = TRUE)
level2 <- sample(seq(20,17, length.out = 20), n, replace = TRUE)
level3 <- sample(seq(17,15, length.out = 20), n, replace = TRUE)
widths <- sample(seq(3,20, length.out = 30), (n*3), replace = TRUE)
#Setting up needed iteration options#
colors_n <- rep(blues[3:1], each = n)
levels_n <- c(level3, level2, level1)
starts <- sample(seq(xmin, xmax, length.out = 30), (n*3), replace = TRUE)
list_opts <- list(levels_n, widths, colors_n, starts)
#building compilation#
buildings <- pmap_df(list_opts, ~tibble(x = ..4,
xend = x,
y = ymax,
yend = ..1,
colors = ..3,
size = ..2))
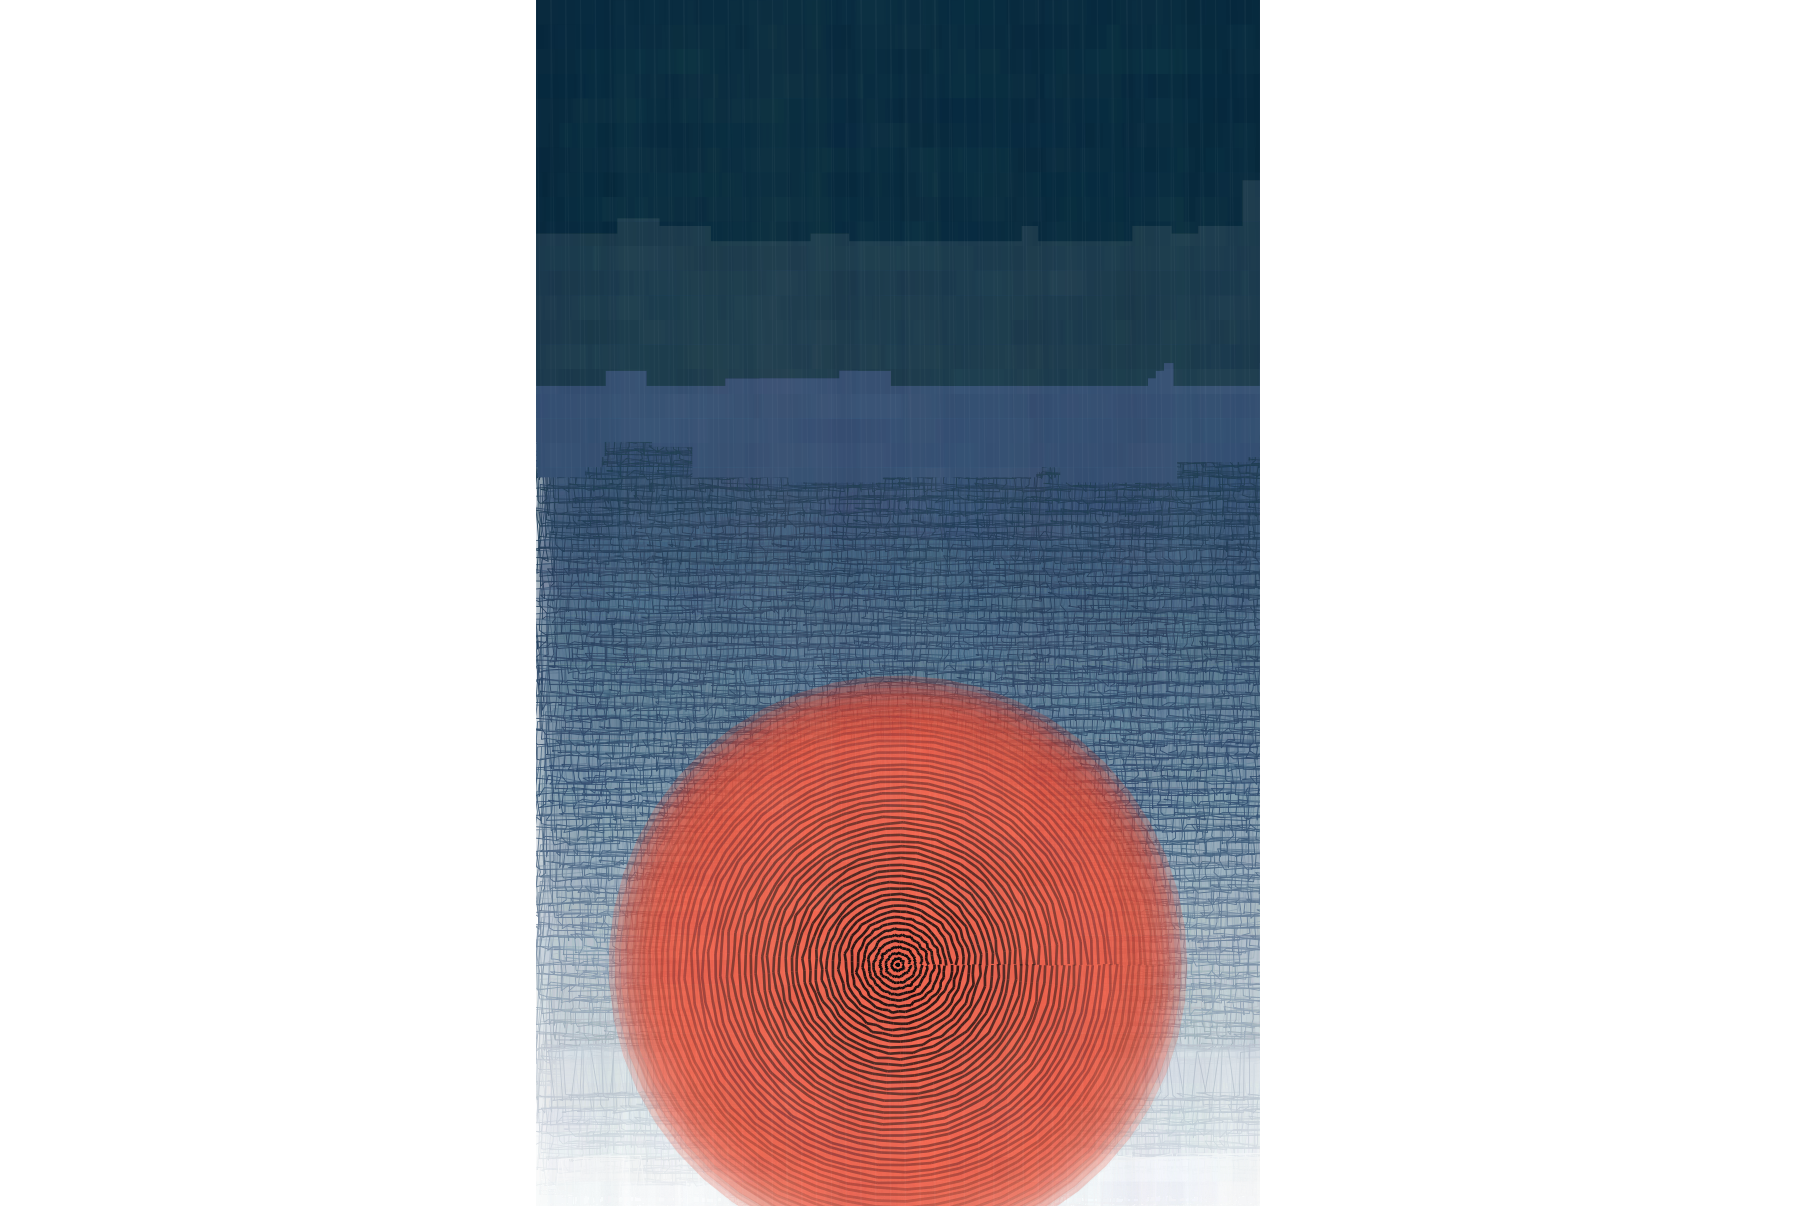
#Work for the red circle#
#Setting the angles of the circles#
theta <- seq(0, 2*pi, length.out = 50)
#Creating a base unit circle#
spiral <- tibble(x = cos(theta),
y = sin(theta))
#compilation or the red circle#
spiral_df <- map2_df(rev(colorRampPalette(c(red, "#ffffff", red, "#06273A"))(50)), seq(0,6, length.out = 50), ~spiral |>
mutate(x = x*.y + 7.5,
y = y * .y + 5,
group = paste0("group",.y),
fill = .x,
x = rev(x),
y = rev(y)))
#Texture overlay for the image#
texture <- tibble(expand.grid(x = seq(xmin,xmax, length.out = 50),
y = seq(ymin,ymax, length.out = 50)))
buildings |>
ggplot(aes(x,xend = xend,y,yend = yend))+
theme_void()+
geom_polygon(data = square_grid, aes(x,y, group = group),
color = colorRampPalette(c("#ffffff",blues[3:1]))(nrow(square_grid)),
fill = rev(square_grid$fill),
inherit.aes = FALSE,
linewidth = .1,
alpha = .2,
position = position_jitter(width = .1, height = .1)) +
geom_segment(linewidth = buildings$size,
color = buildings$colors)+
geom_polygon(data = spiral_df, aes(x,y, group = group),
fill = spiral_df$fill,
inherit.aes = FALSE, alpha = .2)+
geom_path(data = spiral_df, aes(x,y, group = group),
color = "#000000",
linewidth = .3,
position = position_jitter(width = .03, height = .02),
inherit.aes = FALSE,
alpha = seq(1,0, length.out = nrow(spiral_df)))+
geom_path(data = texture, aes(x,y),
inherit.aes = FALSE,
color = sample(blues, nrow(texture), replace = TRUE),
linewidth = sample(seq(0,10, length.out = 30), nrow(texture), replace = TRUE),
alpha = .009)+
geom_path(data = texture, aes(x,y),
inherit.aes = FALSE,
color = "#ffffff",
linewidth = .1,
alpha = .03)+
coord_equal(xlim = c(xmin,xmax),
ylim = c(ymin,ymax),
expand = FALSE)
#To save the output:
# ggsave("07.png",
# dpi = 300,
# device = "png",
# bg = "transparent")