#=============================================================================#
#Library Load-in---------------------------------------------------------------
#=============================================================================#
library(dplyr) #For data wrangling/manipulation
library(purrr) #For list wrangling/manipulation/iterations
library(ggplot2) #For plotting
#=============================================================================#
#Data Set-up-------------------------------------------------------------------
#=============================================================================#
#Angles in a circle#
theta <- seq(0,2*pi, length.out = 100)
#Creating a basic unit circle#
unit_circle <- tibble(x = cos(theta),
y = sin(theta))
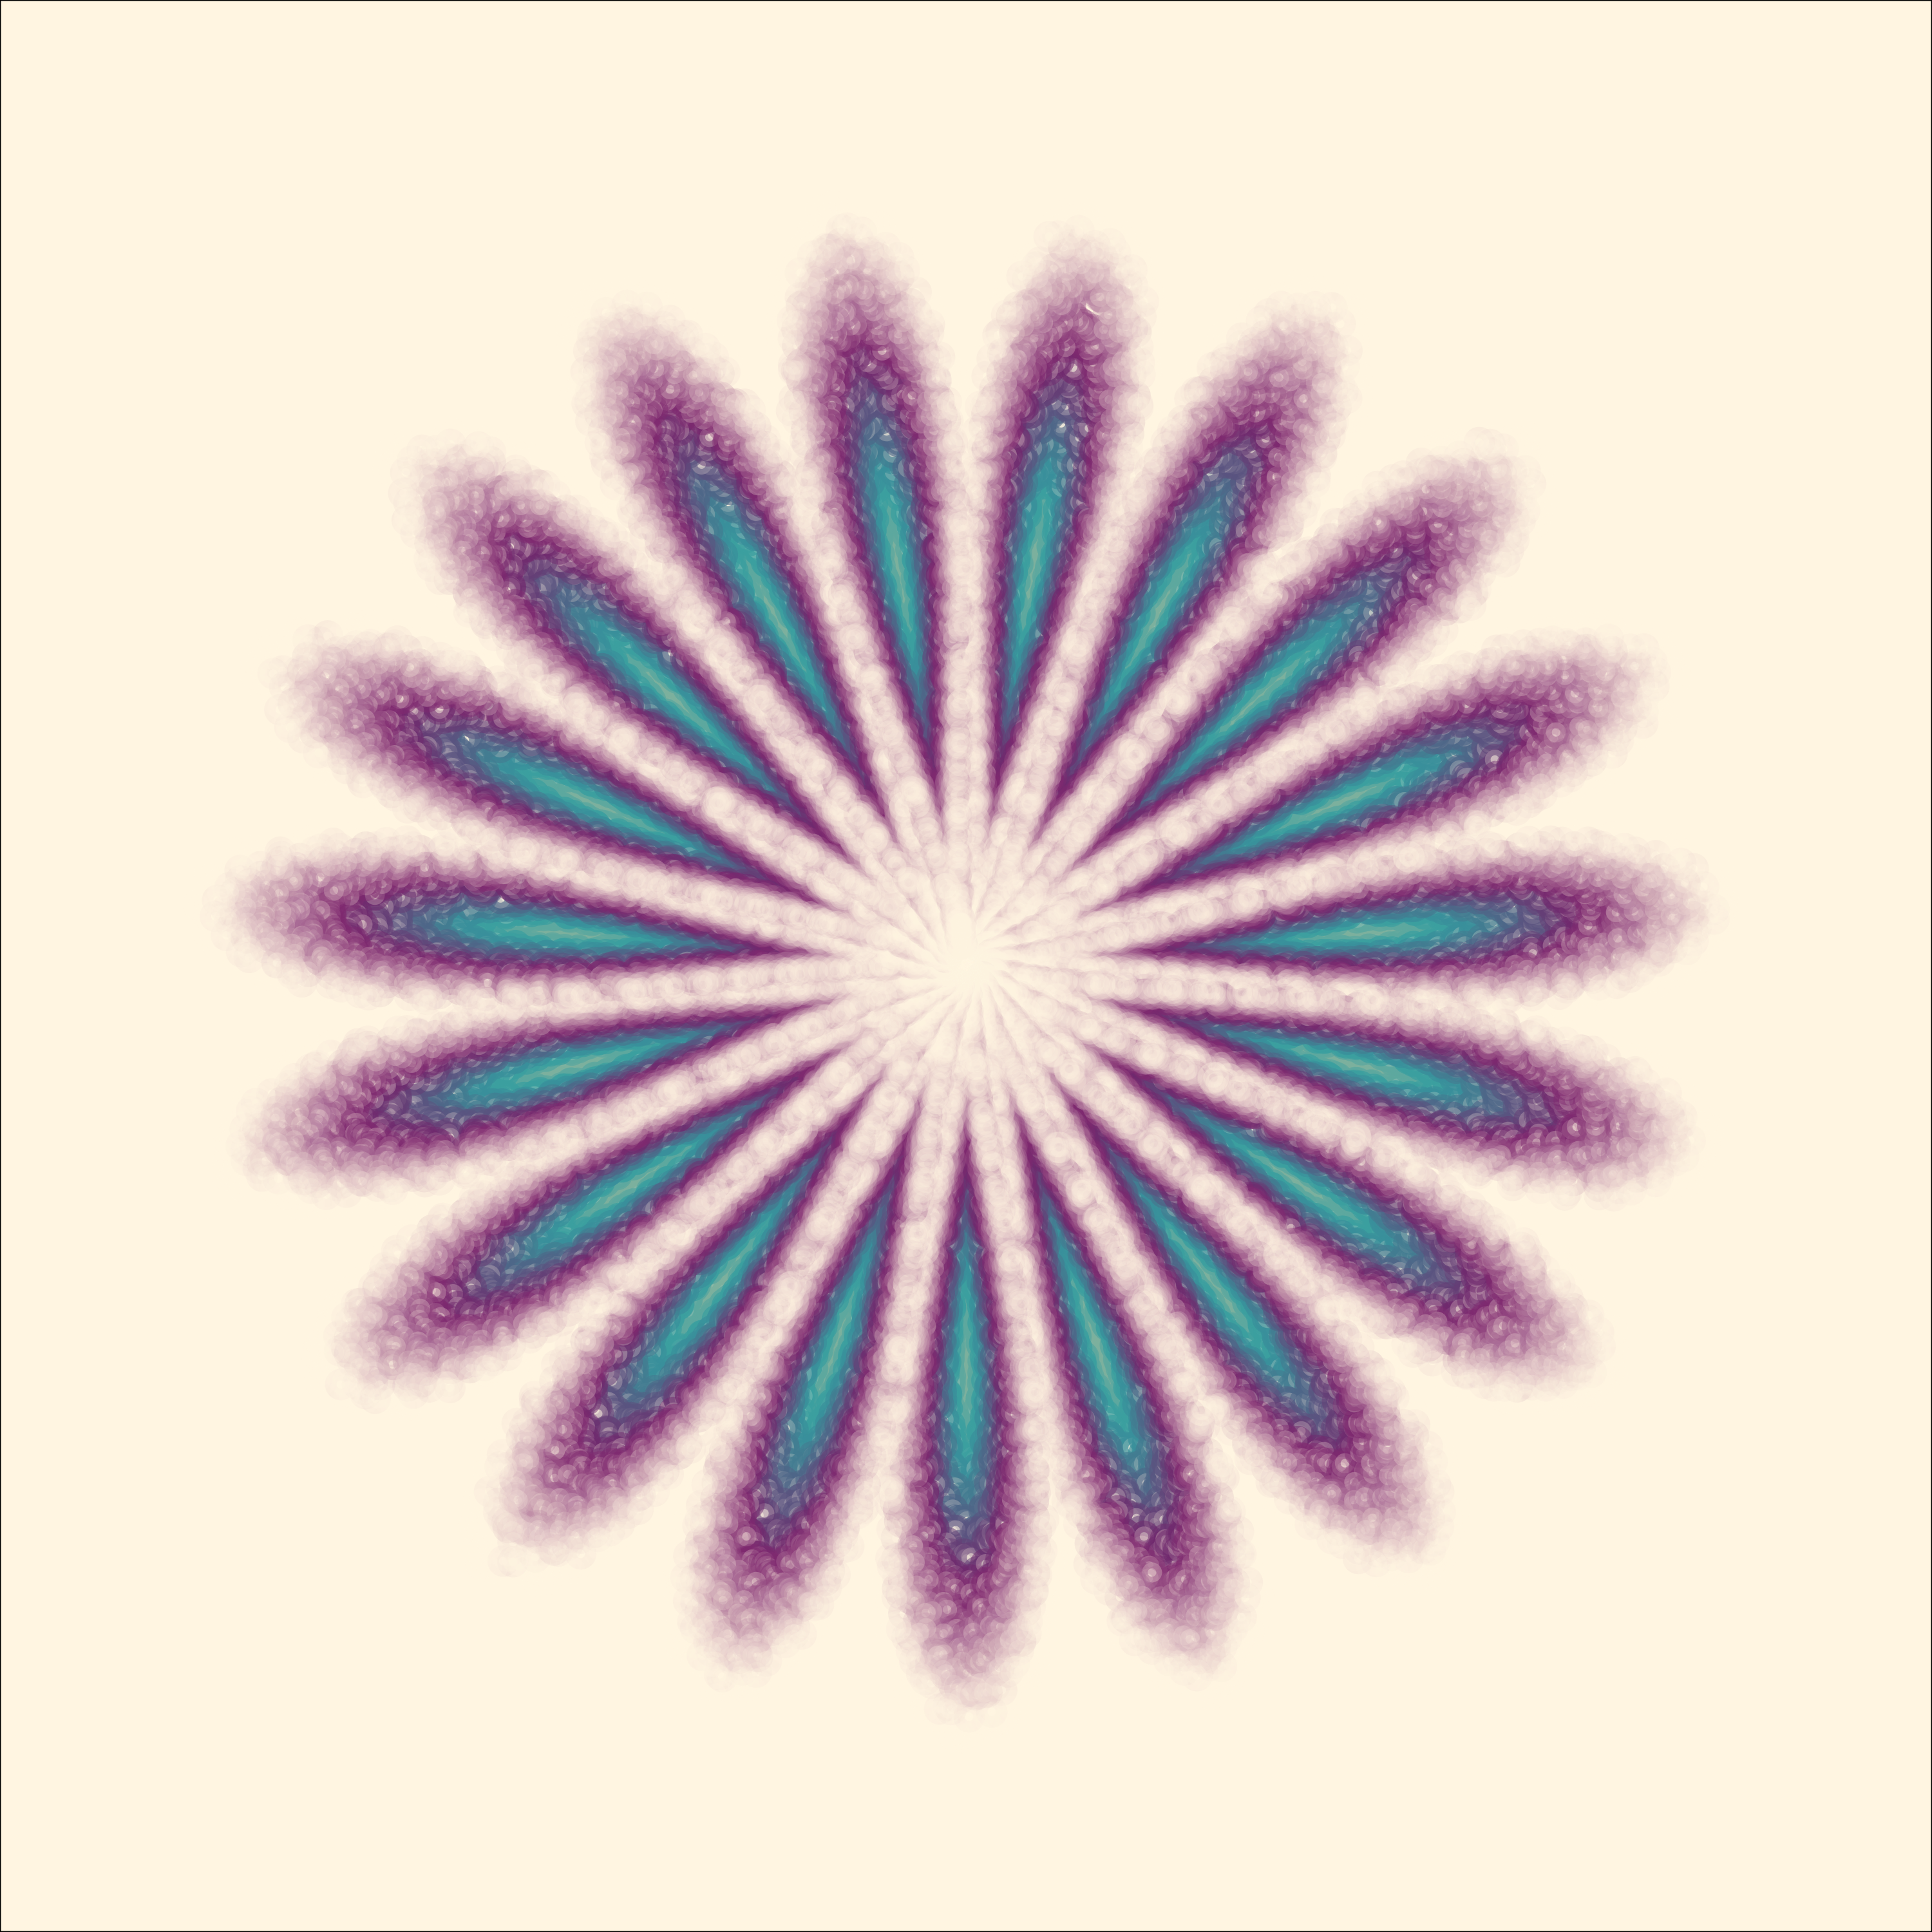
#Picking out a color palette#
color_pal <- c("#FFD39A", "#319DA0", "#781C68", "#FFF5E1")
#Setting background color#
background <- "#fff5e1"
#Setting the petal amount (n)#
n = 20
#Creating iterations
n_iters <- 1:n
#Setting x and y transformations#
trans <- seq(0,.5, length = n)
#Setting colors#
fills <- colorRampPalette(color_pal)(n)
#Setting transparencies#
alphas <- seq(1,.2, length = n)
#Setting List options#
list_opts <- list(trans,
fills,
alphas)
#=============================================================================#
#Data Compilation--------------------------------------------------------------
#=============================================================================#
base <- pmap_df(list_opts, ~unit_circle|>
mutate(x = x * ..1,
y = y * ..1,
group = paste0("circle",..1),
fill = ..2,
alpha = ..3
)
)
final <- map_df(n_iters, ~base|>
mutate(x = x + .x,
group = paste0("circle",.x)
)
)
#=============================================================================#
#Final Piece-------------------------------------------------------------------
#=============================================================================#
final |>
ggplot(aes(x,y, group = group))+
theme_void()+
theme(plot.background = element_rect(fill = background))+
geom_point(color = final$fill,position = position_jitter(width = .01, height = .02),
alpha = final$alpha,
fill = background,
shape = 21,
stroke = 3)+
coord_polar()
#Use to save output:
# ggsave("images/gen_2.png",
# dpi = 300,
# device = "png",
# bg = "transparent",
# height = 10,
# width = 10)