Rotates the x and y points in a given data frame by a given angle based on a designated anchor point.
Arguments
- data
A data frame or tibble with at least
xandyvariables- x
A numeric variable in
data. The variable intended to be plotted on the x axis in aggplot.- y
A numeric variable in
data. The variable intended to be plotted on the y axis in aggplot.- angle
The angle (in degrees) the points in
datawill be rotated around it's anchor- anchor
The anchor point for the rotation. Default is "center". Options include:"center", "bottom", "top", "left", and "right"
- drop
Logical
TRUEorFALSEthat determines if all other variables that are not being rotated are removed from the final output. Default isFALSE.
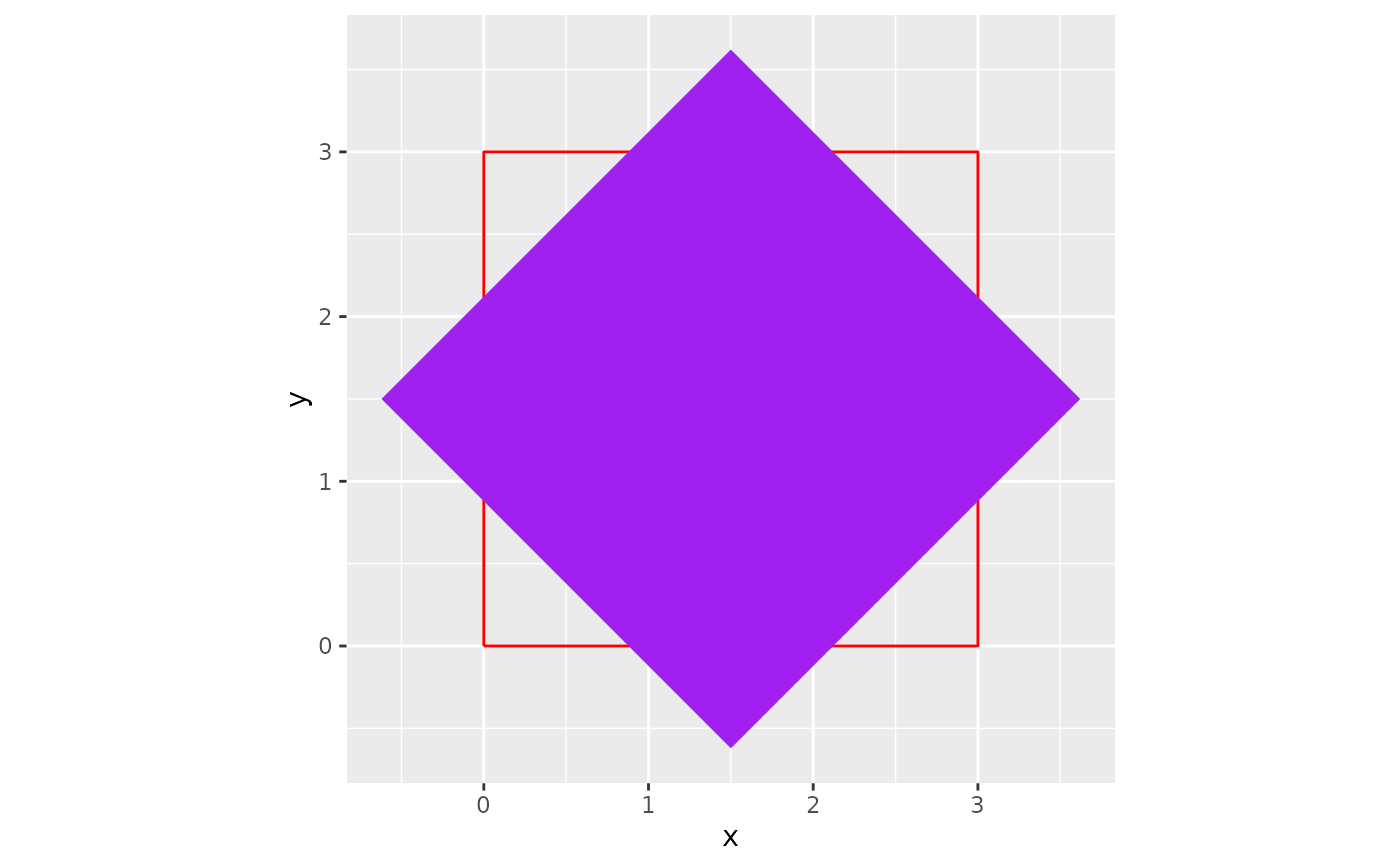
Examples
library(ggplot2)
original_square <- data.frame(
  x = c(0, 3, 3, 0, 0),
  y = c(0, 0, 3, 3, 0)
)
rotated_square <- rotator(data = original_square,
                          x = x,
                          y = y,
                          angle = 45,
                          anchor = "center")

ggplot()+
  geom_path(data = original_square,
                     aes(x,y),
                     color = "red")+
  geom_polygon(data = rotated_square,
                        aes(x,y),
                        fill = "purple")+
  coord_equal()