![[Experimental]](figures/lifecycle-experimental.svg)
A tool for creating a data frame of values that create a circle packing design when plotted.
When the default circle_type "whole" is used, the output should mapped with geom_polygon
in a ggplot. When "swirl" is used, the output should be mapped with geom_path for the best results.
Usage
packer(
  n,
  min_x = 0,
  max_x = 100,
  min_y = 0,
  max_y = 100,
  big_r = 5,
  med_r = 3,
  small_r = 1,
  color_pal = NULL,
  color_type = "regular",
  circle_type = "whole"
)
Arguments
- n
The total number of circles you would like the function to attempt to create. A single numeric value with a minimum value of 10.
- min_x
The minimum limit of the x-axis - the left 'border' of the canvas A single numeric value.
- max_x
The maximum limit of the x-axis - the right 'border' of the canvas A single numeric value.
- min_y
The minimum limit of the y-axis - the bottom 'border' of the canvas A single numeric value.
- max_y
The maximum limit of the y-axis - the top 'border' of the canvas A single numeric value.
- big_r
The radius used for your 'big' sized circles A single numeric value.
- med_r
The radius used for your 'medium' sized circles. A single numeric value.
- small_r
The radius used for your 'small' sized circles. A single numeric value.
- color_pal
A vector of hex color codes that will be mapped to the data.
- color_type
Default is "regular" - The colors will be mapped in order from big circles to small circles. "reverse" - The colors will be mapped in reversed order from small to big circles. "random" - The colors will be mapped randomly to any sized circle.
- circle_type
Default is "whole" - Regular circles. "swirl" - circles are replaced with spirals. Spirals should be mapped with
geom_pathin a ggplot for the best results.
Examples
library(ggplot2)
set.seed(0310)
packed_circles <- packer(
n = 50, big_r = 5, med_r = 3, small_r = 1,
min_x = 0, max_x = 100, min_y = 0, max_y = 100
)
#> ⠙ Sampling for big-sized circles started
#> ✔ Sampling for big-sized circles started [16ms]
#>
#> ℹ Big-sized circles complete!
#> ✔ Big-sized circles complete! [18ms]
#>
#> ⠙ Sampling for medium-sized circles started
#> ✔ Sampling for medium-sized circles started [42ms]
#>
#> ℹ Medium-sized circles complete!
#> ✔ Medium-sized circles complete! [13ms]
#>
#> ⠙ Sampling for small-sized circles started
#> ✔ Sampling for small-sized circles started [27ms]
#>
#> ℹ Small-sized circles complete!
#> ✔ Small-sized circles complete! [21ms]
#>
packed_circles
#> # A tibble: 5,000 × 3
#> # Groups: group [50]
#> x y group
#> <dbl> <dbl> <chr>
#> 1 13 19 big_1
#> 2 13.0 19.3 big_1
#> 3 13.0 19.6 big_1
#> 4 12.9 19.9 big_1
#> 5 12.8 20.3 big_1
#> 6 12.8 20.6 big_1
#> 7 12.6 20.9 big_1
#> 8 12.5 21.1 big_1
#> 9 12.4 21.4 big_1
#> 10 12.2 21.7 big_1
#> # ℹ 4,990 more rows
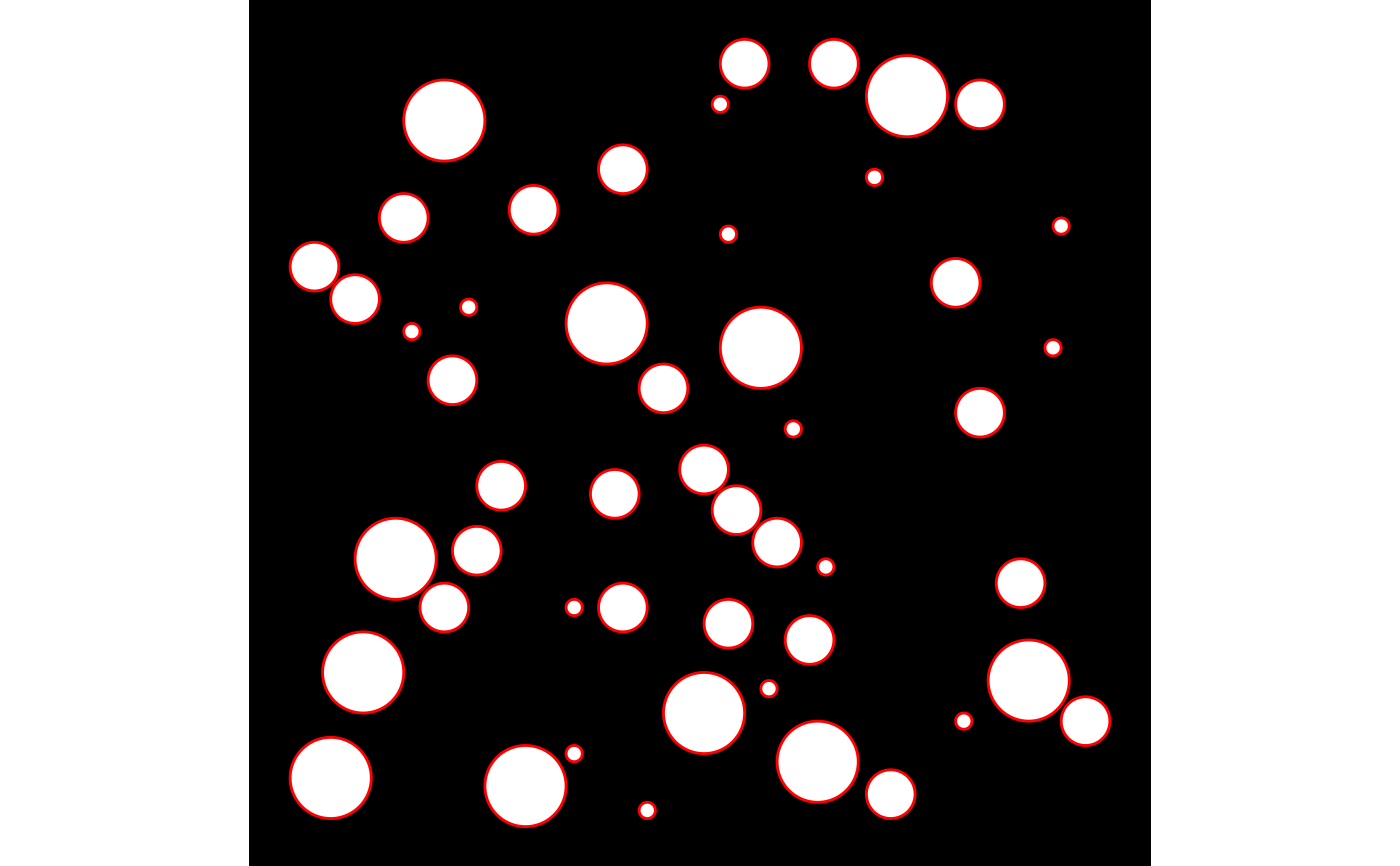
packed_circles |>
ggplot(aes(x, y, group = group)) +
theme_void() +
theme(plot.background = element_rect(fill = "black")) +
geom_polygon(fill = "white", color = "red") +
coord_equal()