circle_data
circle_data(
    x,
    y,
    radius,
    color=None,
    fill=None,
    n_points=100,
    group_var=False,
    group_value='circle_',
)
Generate data for plotting a circle as a DataFrame.
Creates a data frame of (x, y) coordinates representing a circle with a specified center and radius.
Notes
The output is designed for use with geom_path and geom_polygon geoms in plotnine for generative art.
Parameters
- x
float or int— The center x-coordinate of the circle. (default: required)- y
float or int— The center y-coordinate of the circle. (default: required)- radius
float or int— The radius of the circle. Must be greater than 0. (default: required)- color
str— The outline color of the circle. Default None. (default:None)- fill
str— The fill color of the circle. Default None. (default:None)- n_points
int— Number of points to generate along the circle’s perimeter. Must be an integer >= 10 for a reasonable approximation of a circle. (default:100)- group_var
bool— Whether to include a grouping variable in the output. (default:False)- group_value
str— Prefix for the grouping variable name. Required ifgroup_varis True. (default:"circle_")
Returns
- data
pl.DataFrame— A DataFrame containing the circle’s coordinates with columns:- x: x-coordinates of points along the circle’s perimeter
- y: y-coordinates of points along the circle’s perimeter
- color: outline color (if specified)
- fill: fill color (if specified)
- group: grouping variable (if group_var is True)
Examples
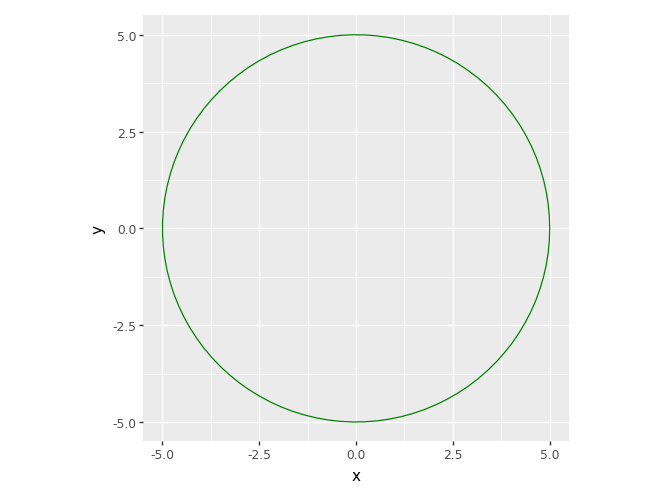
from artpack.circles import circle_data
from plotnine import ggplot, aes, geom_path, coord_equal

one_circle = circle_data(x=0, y=0, radius=5)
(ggplot(one_circle, aes("x", "y")) + geom_path(color="green") + coord_equal())