art_pals
art_pals(pal='ocean', n=5, direction='regular', randomize=False)The artpack palette picker. The art_pals function consists of 18 palettes.
Parameters
- pal
str— A character string of the desired artpack palette. Default is “ocean”. (default:'ocean')- n
int— The number of colors desired in the output. Default is 5. Must be a positive integer with a value greater than 0. (default:5)- direction
str— The direction of the palette. Default is “regular”. Options: “regular”, “reg”, “reverse”, “rev” (default:'regular')- randomize
bool— Determines if the colors in the palette appear in a randomized order. Default is False. (default:False)
Notes
The 18 artpack palettes include:
- “arctic” - Icy blue and white colors
- “beach” - Sand-colored tans and ocean-colored blue colors
- “bw” - A gradient of black to white colors
- “brood” - A gradient of different shades of dark gray and black colors
- “cosmos” - Nebula-inspired blue, purple, and pink colors
- “explorer” - Pokemon-type inspired colors
- “gemstones” - Birthstone/Mineral-inspired colors
- “grays” - A gradient of dark, medium, and light gray colors
- “icecream” - A light pastel palette of cream, blue, brown, and pink colors
- “imagination” - 90’s school supply-inspired colors
- “majestic” - Shades of majestic purple colors
- “nature” - A mix of tan, brown, green, and red colors
- “neon” - A neon spectrum of rainbow colors
- “ocean” - A gradient of dark to light blue colors
- “plants” - A gradient of dark to light green colors
- “rainbow” - A vibrant mix of rainbow colors
- “sunnyside” - A retro-inspired mix of pink, orange, and yellow colors
- “super” - A marveling mix of heroic colors
Returns
- colors
List[str]— A list of hexadecimal color codes.
Examples
# Import Modules------
import plotnine as p9
from polars import DataFrame
from artpack import art_pals
# Data Creation------
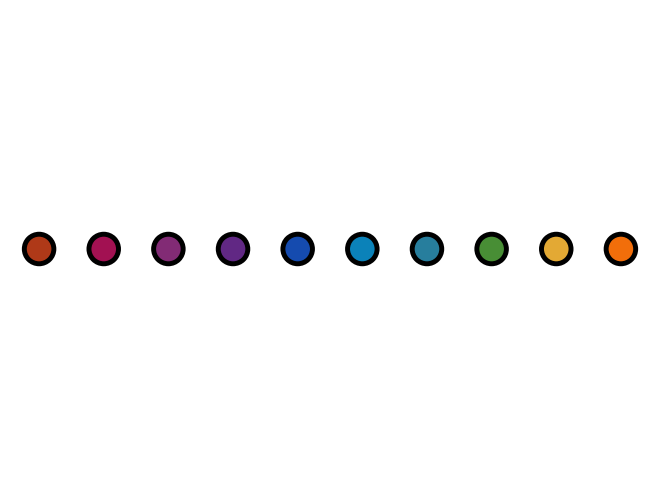
n_pal = 10
df_dots = DataFrame(
{"x": range(1, n_pal + 1), "y": [2.5] * n_pal, "fills": art_pals("rainbow", n_pal)}
)
# Plot data to see colors------
(
p9.ggplot(data=df_dots, mapping=p9.aes("x", "y"))
+ p9.theme_void()
+ p9.geom_point(
shape="o",
fill=df_dots["fills"].to_list(),
color="#000000",
size=10,
stroke=2
)
)